Fig. 2
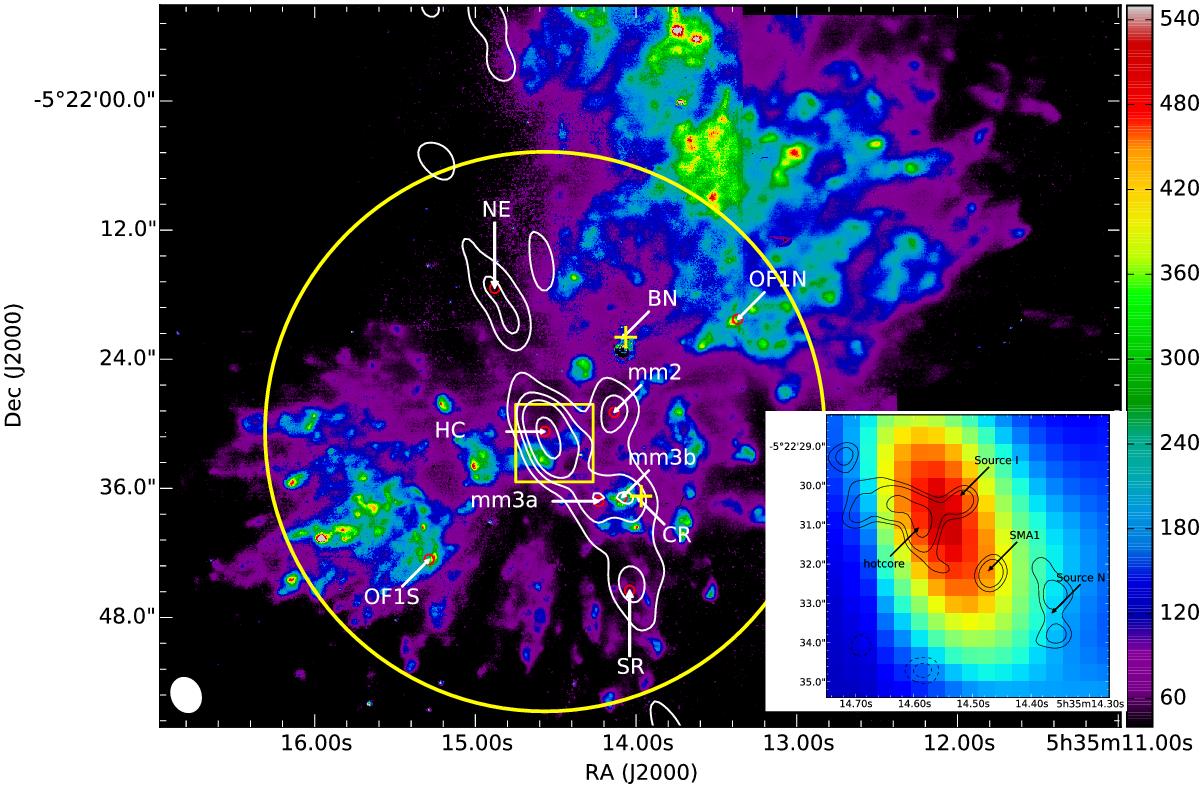
Substructures resolved by SMA-only observations at a spatial resolution of ~1200 AU. White contours show the 1.3 mm continuum emission at −5σ, 5σ, 15σ, 25σ, 60σ rms levels with the σ = 0.04 Jy beam-1. The yellow circle denotes the primary beam of SMA at 1.3 mm. Red circles denote the peaks of hot core (HC), mm2, mm3a, mm3b, the southern region (SR), north-east clump (NE), the NW and SE parts of the high-velocity outflow (OF1N, OF1S). Yellow crosses denote the BN object and the compact ridge (CR). The beam in the bottom left corner is from the SMA-only data. Colourmap shows the brightness (in counts per 400 s) of shocked H2 emission (Nissen et al. 2007). Corresponding to the yellow square, the insert panel shows the HC continuum from the SMA at 1.3 mm in detail as colourmap, with black contours of the 865 μm continuum emission at a spatial resolution of ~300 AU from Beuther et al. (2004) overlaid.
Current usage metrics show cumulative count of Article Views (full-text article views including HTML views, PDF and ePub downloads, according to the available data) and Abstracts Views on Vision4Press platform.
Data correspond to usage on the plateform after 2015. The current usage metrics is available 48-96 hours after online publication and is updated daily on week days.
Initial download of the metrics may take a while.