Fig. A.3
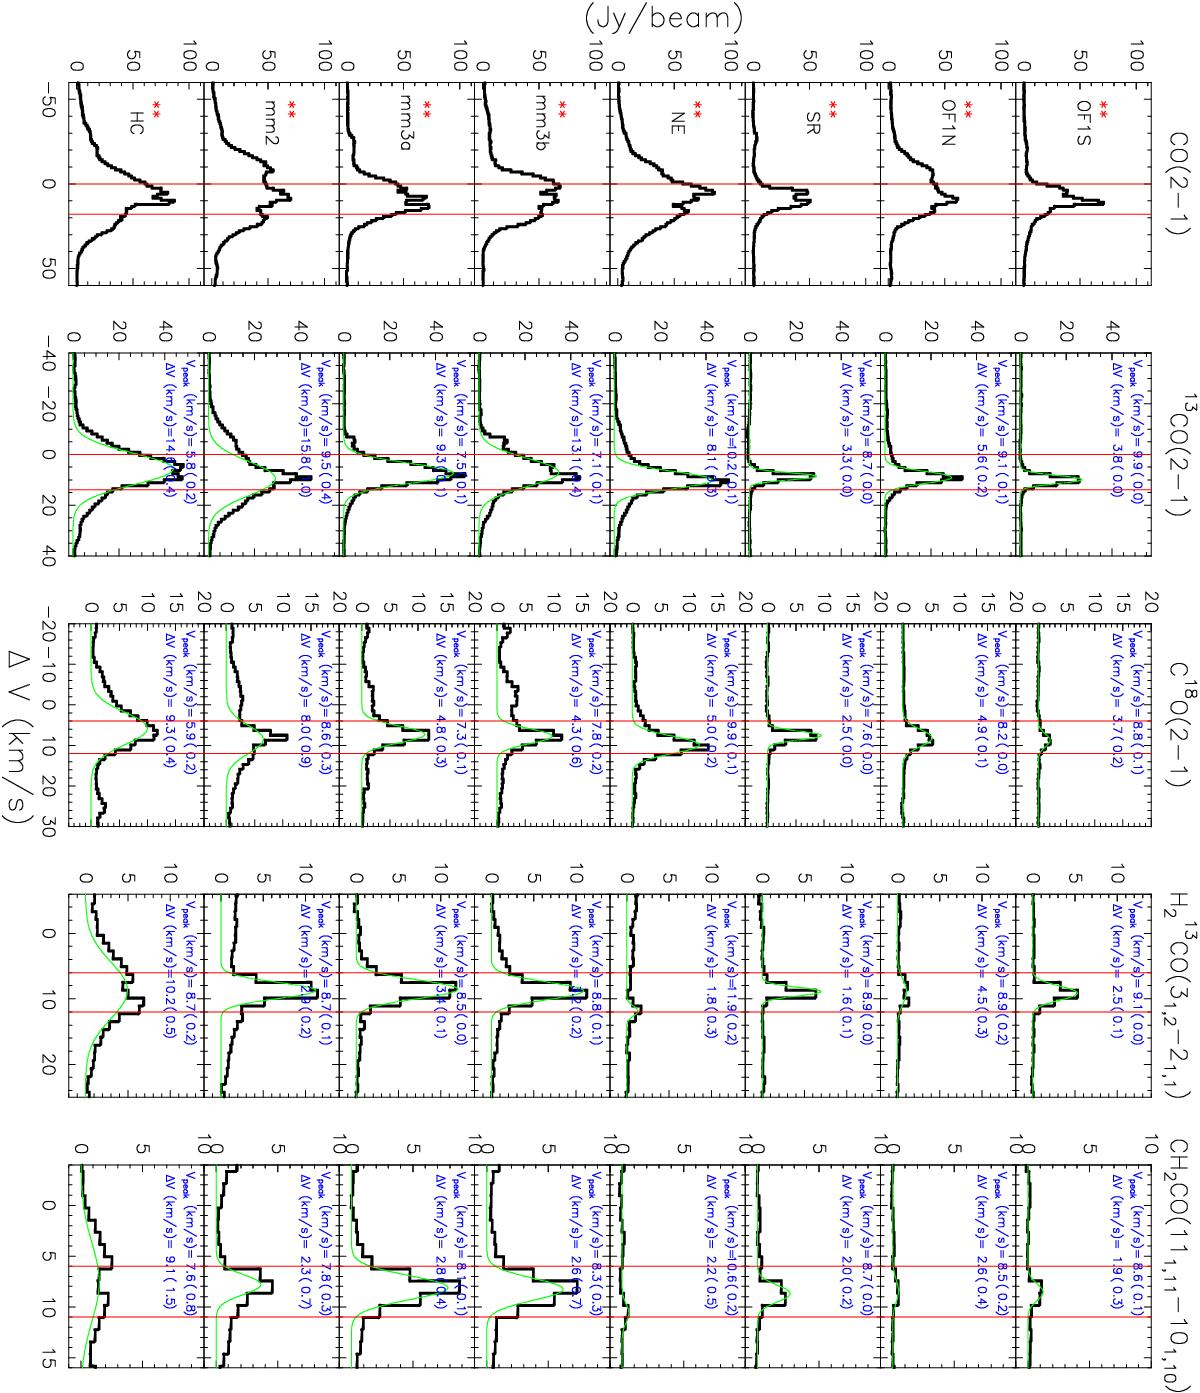
Line profiles of identified species from each continuum peak. In measuring the main Vpeak and ΔV of each line at each substructure, lines in green and notes in blue (in the form of “value(error)”) are given by the Gaussian fittings using Gildas software. Multi-Gaussian fittings are used to CH3CN, ![]() , HCOOCH3 (ν = 0), and CH3COCH3 due to blending, and to SO2, 34SO2, and SO due to the second velocity component (the second velocity component of HNCO measured from multi-Gaussian fittings are given in Fig. 7). Single Gaussian fittings are used to the rest lines, while lines whose Vpeak cannot be measured by Gaussian fittings owing to strong self-absorption are marked with “**”, and non-detections are not marked. Two red vertical lines in each panel mark the velocity range over which the emission from each species is integrated to make the distribution maps shown in Figs. 4 and 5.
, HCOOCH3 (ν = 0), and CH3COCH3 due to blending, and to SO2, 34SO2, and SO due to the second velocity component (the second velocity component of HNCO measured from multi-Gaussian fittings are given in Fig. 7). Single Gaussian fittings are used to the rest lines, while lines whose Vpeak cannot be measured by Gaussian fittings owing to strong self-absorption are marked with “**”, and non-detections are not marked. Two red vertical lines in each panel mark the velocity range over which the emission from each species is integrated to make the distribution maps shown in Figs. 4 and 5.
Current usage metrics show cumulative count of Article Views (full-text article views including HTML views, PDF and ePub downloads, according to the available data) and Abstracts Views on Vision4Press platform.
Data correspond to usage on the plateform after 2015. The current usage metrics is available 48-96 hours after online publication and is updated daily on week days.
Initial download of the metrics may take a while.