Fig. A.2
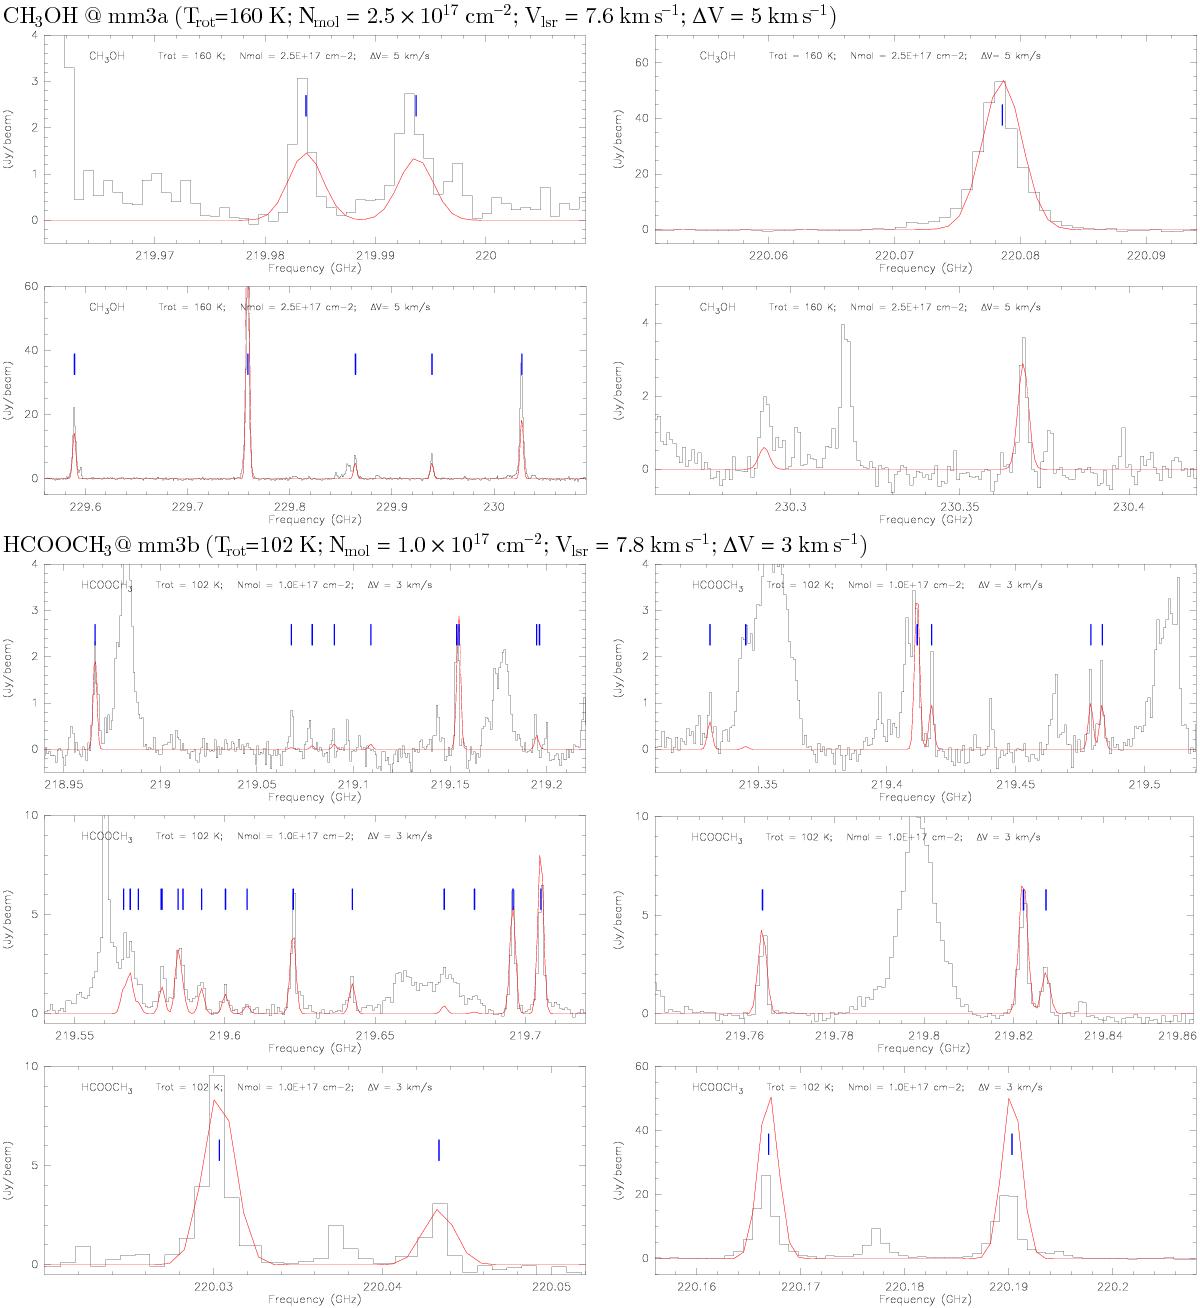
Synthetic spectrum fitting of COMs towards their emission peaks (Vlsr of each species are corrected according to Vpeak from Fig. A.3). The black histograms are the observed spectra, overlaid with a best fit model spectrum for given uniform FWHM linewidth (△ V) (fit from Fig. A.3), Trot (assumed from an adjacent substructure), and Nmol (adjusted based on NT in Tables A.5I−A.7I) listed on top of each panel. Blue lines mark the central frequency of each transition. Uncertainties of the fitting to observations come from the assumption that under LTE, the candidate molecule lines are optically thin, and each species has the same line width at different transitions. Referenced molecular data are from CDMS/JPL (Sanchez-Monge 2011; Palau et al. 2011).
Current usage metrics show cumulative count of Article Views (full-text article views including HTML views, PDF and ePub downloads, according to the available data) and Abstracts Views on Vision4Press platform.
Data correspond to usage on the plateform after 2015. The current usage metrics is available 48-96 hours after online publication and is updated daily on week days.
Initial download of the metrics may take a while.