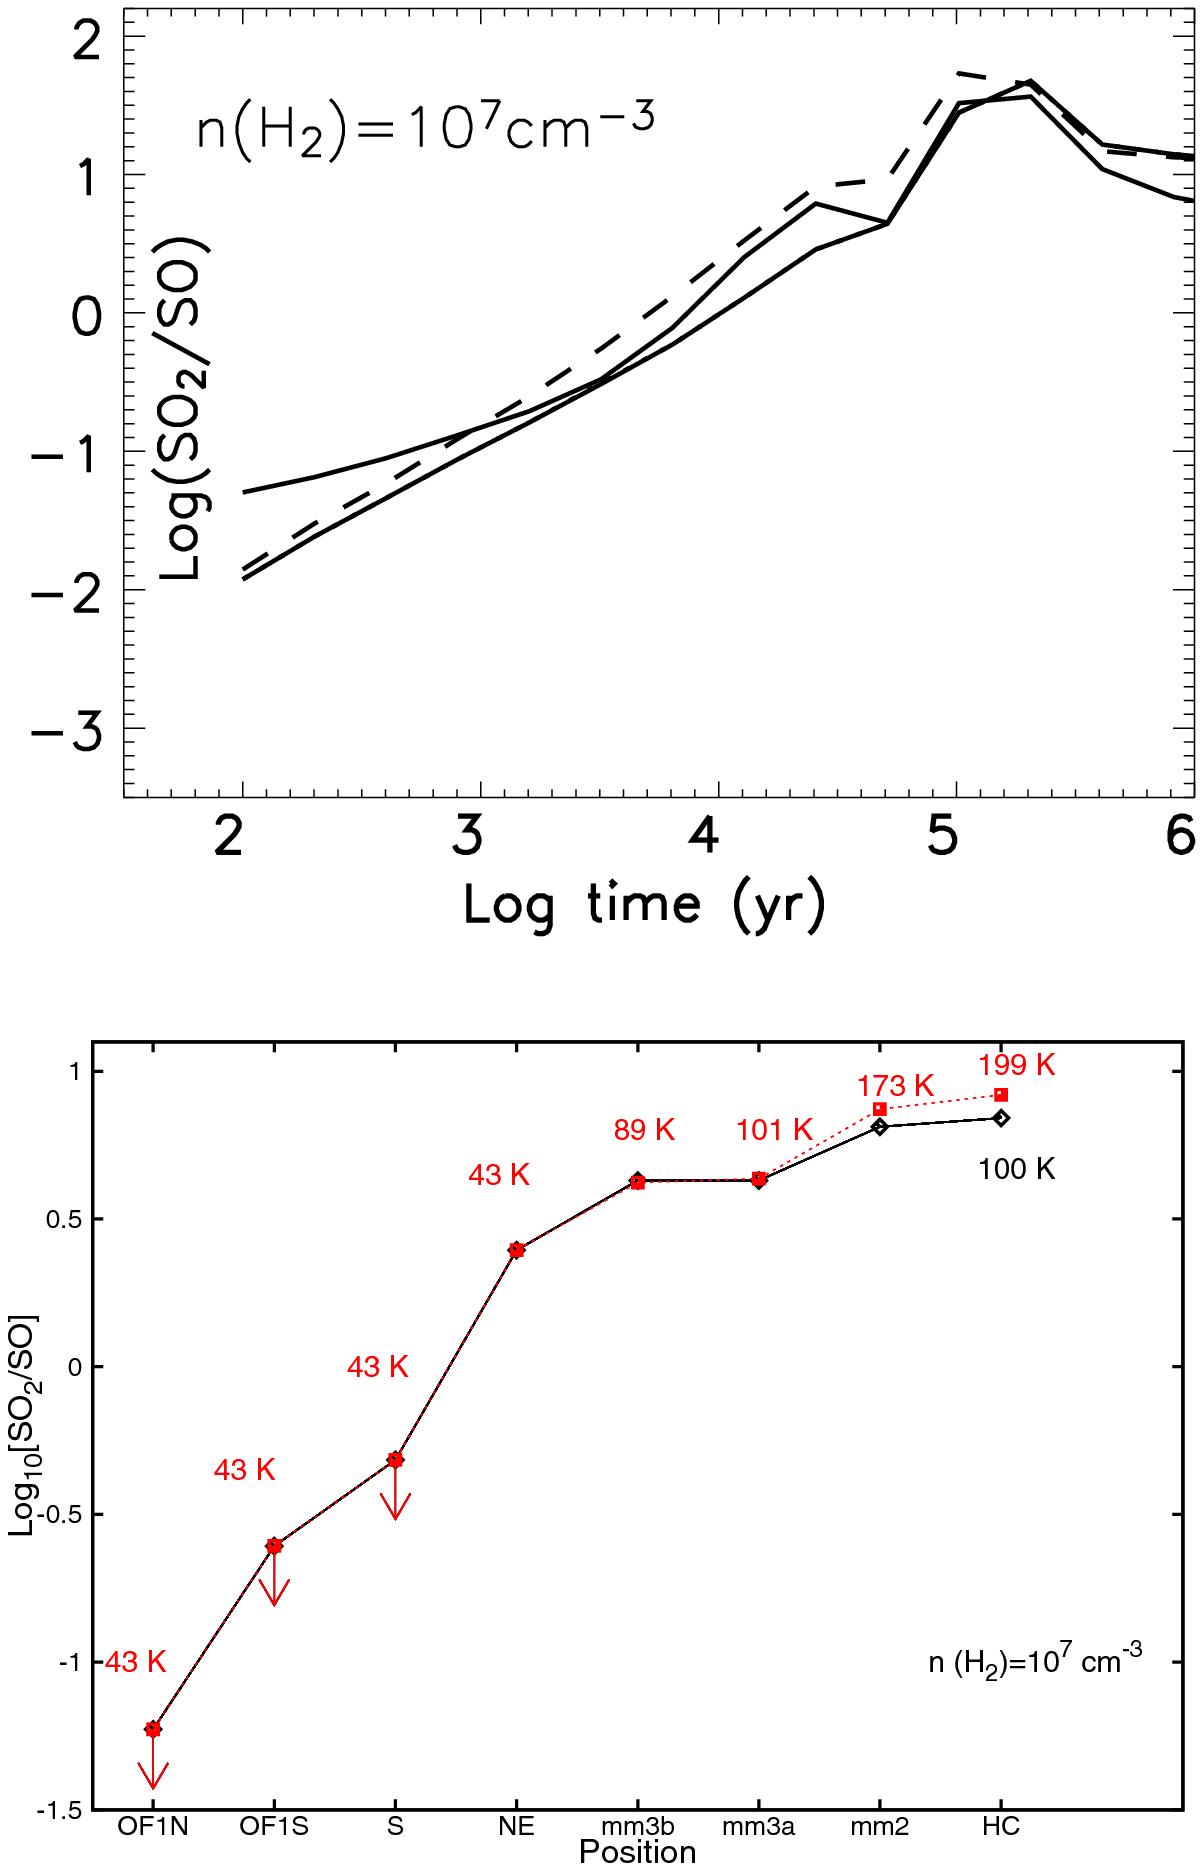
Fig. 11

Observed SO2/ SO ratio compared to the model prediction. The upper panel is adopted from Fig. 5 of Wakelam et al. (2004) (100 K, 107 cm-3), where different line types are from different grain component models. The lower panel is from our observed SO2/ SO ratio by assuming (1) all substructures have similar density 107 cm-3 and (2) NSO2/N34SO2 = 22 (Wilson & Rood 1994). The black solid line comes from the assumption that all substructures have a temperature close to 100 K, and the red dotted line comes from different temperatures derived in Sect. 4.1 (labelled in red).
Current usage metrics show cumulative count of Article Views (full-text article views including HTML views, PDF and ePub downloads, according to the available data) and Abstracts Views on Vision4Press platform.
Data correspond to usage on the plateform after 2015. The current usage metrics is available 48-96 hours after online publication and is updated daily on week days.
Initial download of the metrics may take a while.


