Fig. 1
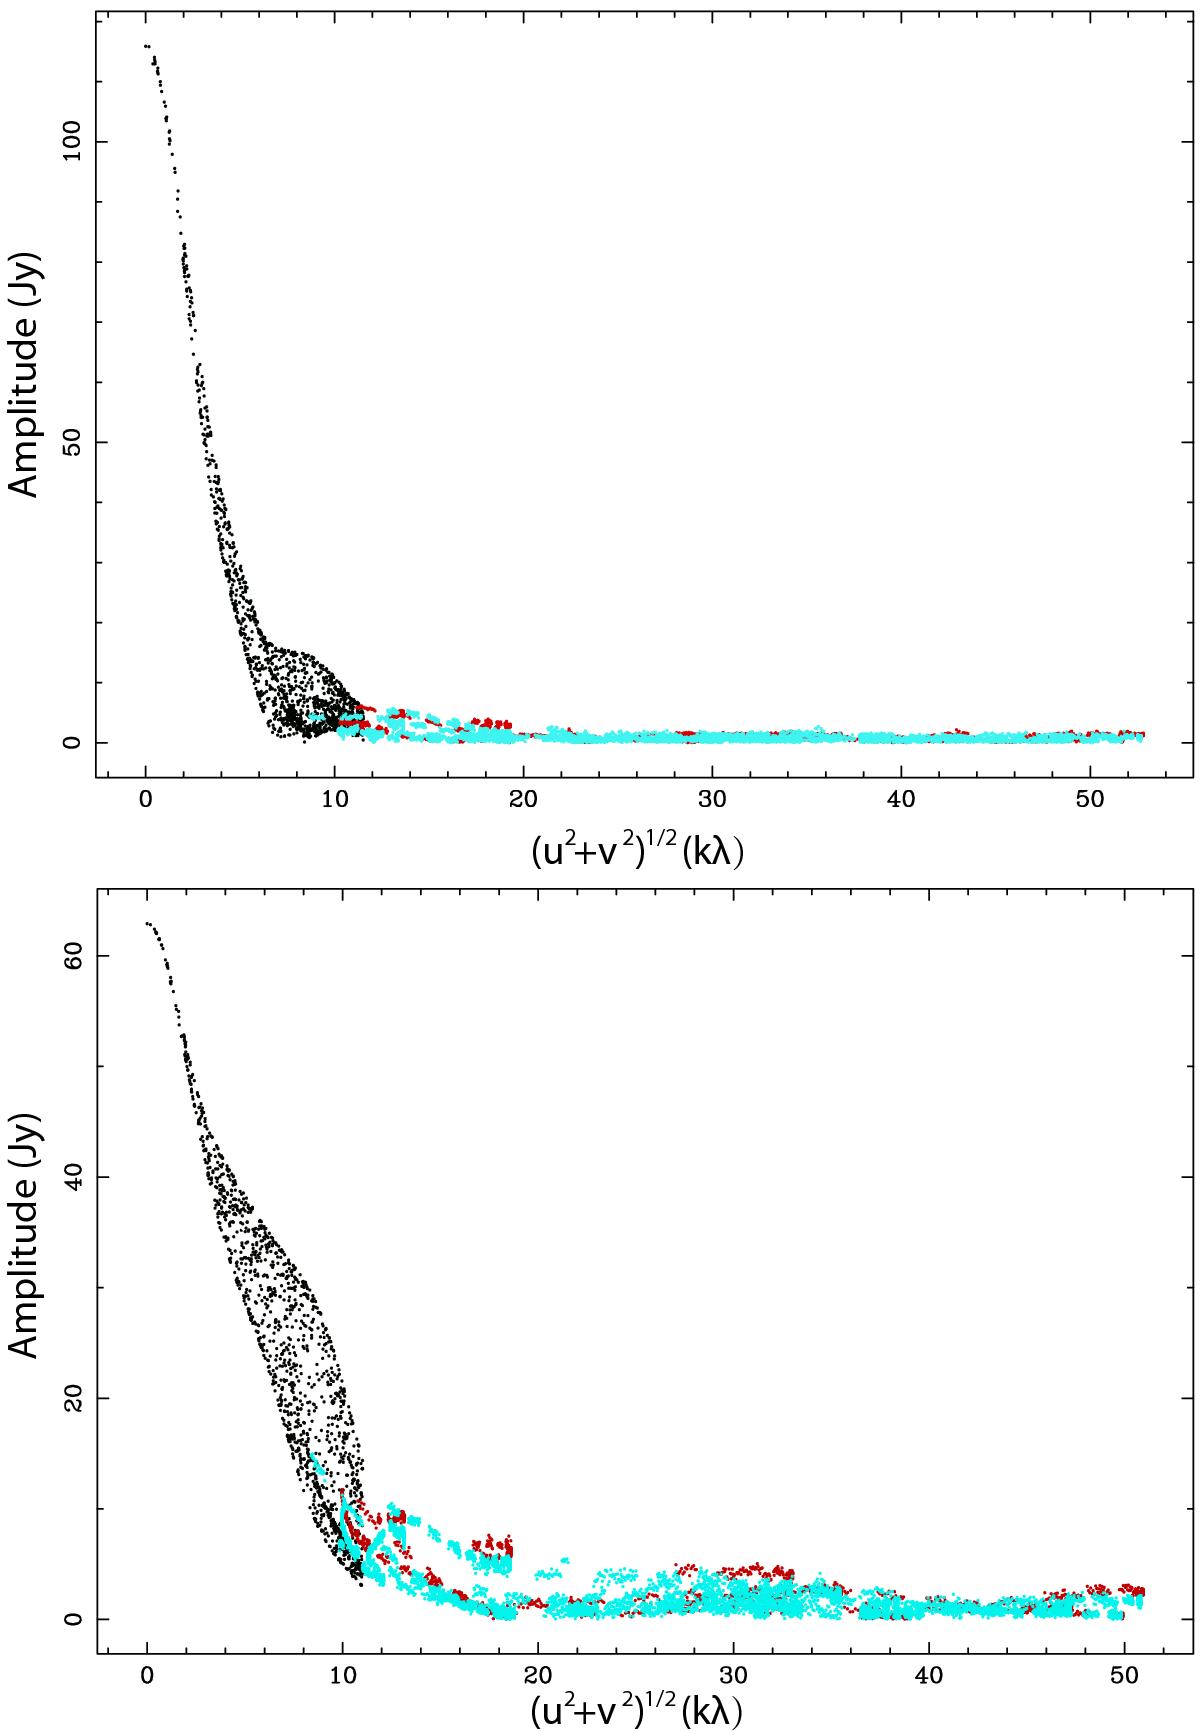
Amplitude in Jy versus the projected baseline showing the combination of the interferometer and single-dish data, from the upper sideband (top) to lower sideband (bottom). Red and blue dots present data from the SMA on Feb. 15, 2005 and Feb. 19, 2005, respectively, showing the lack of baselines shorter than 10 kλ. Black dots are data converted from 30 m single-dish observations, which fill in the missing short spacing information.
Current usage metrics show cumulative count of Article Views (full-text article views including HTML views, PDF and ePub downloads, according to the available data) and Abstracts Views on Vision4Press platform.
Data correspond to usage on the plateform after 2015. The current usage metrics is available 48-96 hours after online publication and is updated daily on week days.
Initial download of the metrics may take a while.