| Issue |
A&A
Volume 581, September 2015
|
|
|---|---|---|
| Article Number | C4 | |
| Number of page(s) | 2 | |
| Section | Astronomical instrumentation | |
| DOI | https://doi.org/10.1051/0004-6361/201220728e | |
| Published online | 17 September 2015 | |
Calibrating high-precision Faraday rotation measurements for LOFAR and the next generation of low-frequency radio telescopes (Corrigendum)
1
Astronomisches Institut der Ruhr-Universität Bochum, Universitätsstr.
150,
44780
Bochum,
Germany
e-mail:
This email address is being protected from spambots. You need JavaScript enabled to view it.
2
Max-Planck-Institut für Radioastronomie,
Auf dem Hügel 69, 53121
Bonn,
Germany
3
ASTRON, the Netherlands Institute for Radio
Astronomy, Postbus
2, 7990 AA
Dwingeloo, The
Netherlands
4
Astronomical Institute “Anton Pannekoek,” University of
Amsterdam, Science Park
904, 1098 XH
Amsterdam, The
Netherlands
5
Kapteyn Astronomical Institute, PO Box 800, 9700 AV
Groningen, The
Netherlands
6
Space Telescope Science Institute, 3700 San Martin Drive, Baltimore, MD
21218,
USA
7
SRON Netherlands Insitute for Space Research, Sorbonnelaan
2, 3584 CA
Utrecht, The
Netherlands
8
ARC Centre of Excellence for All-sky astrophysics (CAASTRO),
Sydney Institute of Astronomy, University of Sydney Australia,
Redfern
NSW
2016,
Australia
9
School of Physics and Astronomy, University of
Southampton, Southampton, SO17
1BJ, UK
10
Max Planck Institute for Astrophysics,
Karl Schwarzschild Str. 1,
85741
Garching,
Germany
11
Institute for Astronomy, University of Edinburgh, Royal
Observatory of Edinburgh, Blackford
Hill, Edinburgh
EH9 3HJ,
UK
12
Leiden Observatory, Leiden University,
PO Box 9513, 2300 RA
Leiden, The
Netherlands
13
University of Hamburg, Gojenbergsweg 112, 21029
Hamburg,
Germany
14
Jacobs University Bremen, Campus Ring 1, 28759 Bremen, Germany
15
Leibniz-Institut für Astrophysik Potsdam (AIP),
An der Sternwarte 16,
14482
Potsdam,
Germany
16
Thüringer Landessternwarte, Sternwarte 5,
07778
Tautenburg,
Germany
17
Department of Astrophysics/IMAPP, Radboud University
Nijmegen, PO Box
9010, 6500 GL
Nijmegen, The
Netherlands
18
Laboratoire Lagrange, UMR 7293, Université de Nice
Sophia-Antipolis, CNRS, Observatoire de la Côte d’Azur, 06300
Nice,
France
19
Laboratoire de Physique et Chimie de l’Environnement et de
l’Espace, LPC2E UMR 7328 CNRS, 45071
Orléans Cedex 02,
France
20
Jodrell Bank Center for Astrophysics, School of Physics and
Astronomy, The University of Manchester, Manchester
M13 9PL,
UK
21
Astrophysics, University of Oxford, Denys Wilkinson
Building, Keble
Road, Oxford OX1
3RH
22
Astro Space Center of the Lebedev Physical
Institute, Profsoyuznaya str.
84/32, 117997
Moscow,
Russia
23
Center for Information Technology (CIT), University of
Groningen, 9712
CP
Groningen, The
Netherlands
24
Centre de Recherche Astrophysique de Lyon, Observatoire de
Lyon, 9 Av. Charles
André, 69561
Saint-Genis Laval Cedex,
France
25
Station de Radioastronomie de Nançay, Observatoire de Paris,
CNRS/INSU, 18330
Nançay,
France
26
LESIA, UMR CNRS 8109, Observatoire de Paris,
92195
Meudon,
France
27
Harvard-Smithsonian Center for Astrophysics, 60 Garden
Street, Cambridge,
MA
02138,
USA
28
Argelander-Institut für Astronomie, University of
Bonn, Auf dem Hügel
71, 53121
Bonn,
Germany
Key words: polarization / techniques: polarimetric / errata, addenda
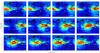 |
Fig. 2 GIMs representing the VTEC across the globe for April 11th, 2011 (the date of the first LOFAR observing campaign, see Sect. 5) obtained courtesy of CODE. The maps range from minimum (blue) to maximum (red) VTEC values of 0.0−87.2 TECU (1 TECU = 1016 electrons/m2). The triangles indicate the location of the LOFAR core stations in the Netherlands, the squares mark the SKA core sites in South Africa and Western Australia, and the circles indicate the site of the GMRT. |
This erratum corrects Figs. 2 and 3 of our original paper (Sotomayor-Beltran et al. 2013). Due to a simple error in plotting the input data, these maps of ionospheric total electron content (TEC) were inverted north-south and improperly stretched to match the underlying cartographic projection. The properly mapped figures are presented here (see also the Appendix of Arora et al. 2015). The ionospheric prediction code, ionFR, and other figures presented in the paper were not affected by this
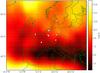 |
Fig. 3 The VTEC across Europe for March 23rd, 2012 (the date of the third LOFAR campaign, see Sect. 5) at 00:00 UT, obtained courtesy of ROB. The square indicates the LOFAR core stations and the triangles represent the locations of the international stations. |
inversion error, which was purely a plotting error applying to Figs. 2 and 3.
This mapping error led to the incorrect conclusion that the Equatorial Ionization Anomaly (EIA) can sometimes pass directly over the planned sites of the Square Kilometre Array (SKA). Though ionospheric calibration is a challenging problem, it is a challenge that is being met (e.g., Arora et al. 2015). Unfortunately, the incorrect assertion that the EIA passes over the chosen sites for the SKA overstated the severity of the problem for these locations, which have been meticulously chosen and proven to be excellent sites for low-frequency radio astronomy.
All other conclusions in the paper remain unaffected.
Acknowledgments
We sincerely thank David Herne, Mervyn Lynch, and John Kennewell for discovering this error and bringing it to our attention.
References
- Arora, B. S., Morgan, J., Ord, S. M., et al. 2015, PASA, 32, 029 [Google Scholar]
- Sotomayor-Beltran, C., Sobey, C., Hessels, J. W. T., et al. 2013, A&A, 552, A58 [NASA ADS] [CrossRef] [EDP Sciences] [Google Scholar]
© ESO, 2015
All Figures
|
Fig. 2 GIMs representing the VTEC across the globe for April 11th, 2011 (the date of the first LOFAR observing campaign, see Sect. 5) obtained courtesy of CODE. The maps range from minimum (blue) to maximum (red) VTEC values of 0.0−87.2 TECU (1 TECU = 1016 electrons/m2). The triangles indicate the location of the LOFAR core stations in the Netherlands, the squares mark the SKA core sites in South Africa and Western Australia, and the circles indicate the site of the GMRT. |
| In the text | |
|
Fig. 3 The VTEC across Europe for March 23rd, 2012 (the date of the third LOFAR campaign, see Sect. 5) at 00:00 UT, obtained courtesy of ROB. The square indicates the LOFAR core stations and the triangles represent the locations of the international stations. |
| In the text | |
Current usage metrics show cumulative count of Article Views (full-text article views including HTML views, PDF and ePub downloads, according to the available data) and Abstracts Views on Vision4Press platform.
Data correspond to usage on the plateform after 2015. The current usage metrics is available 48-96 hours after online publication and is updated daily on week days.
Initial download of the metrics may take a while.