Free Access
Fig. 3
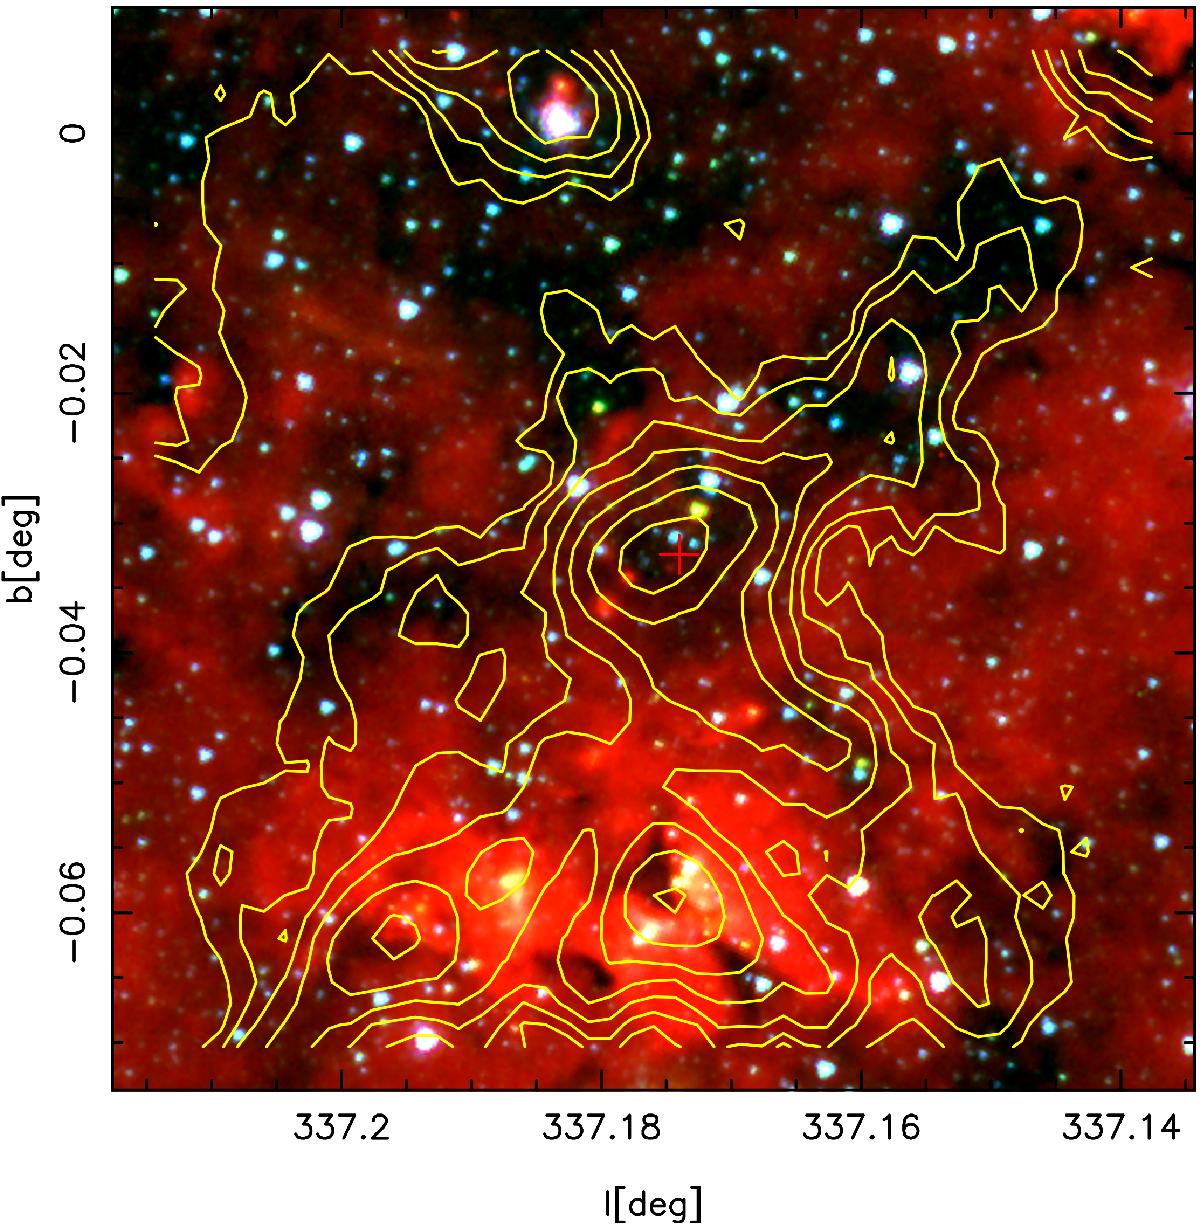
GLIMPSE false-colour image (red: 8 μm; green: 4.5 μm; blue: 3.6 μm) of G337.1. The yellow contours show the 870 μm emission, ranging from 0.281 to 2.24 Jy beam-1 in equal log steps of 0.15 dex. The red plus indicates the position of the molecular-line observations.
Current usage metrics show cumulative count of Article Views (full-text article views including HTML views, PDF and ePub downloads, according to the available data) and Abstracts Views on Vision4Press platform.
Data correspond to usage on the plateform after 2015. The current usage metrics is available 48-96 hours after online publication and is updated daily on week days.
Initial download of the metrics may take a while.