Free Access
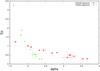
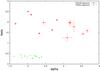
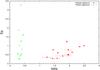
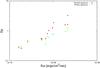
Fig. 4
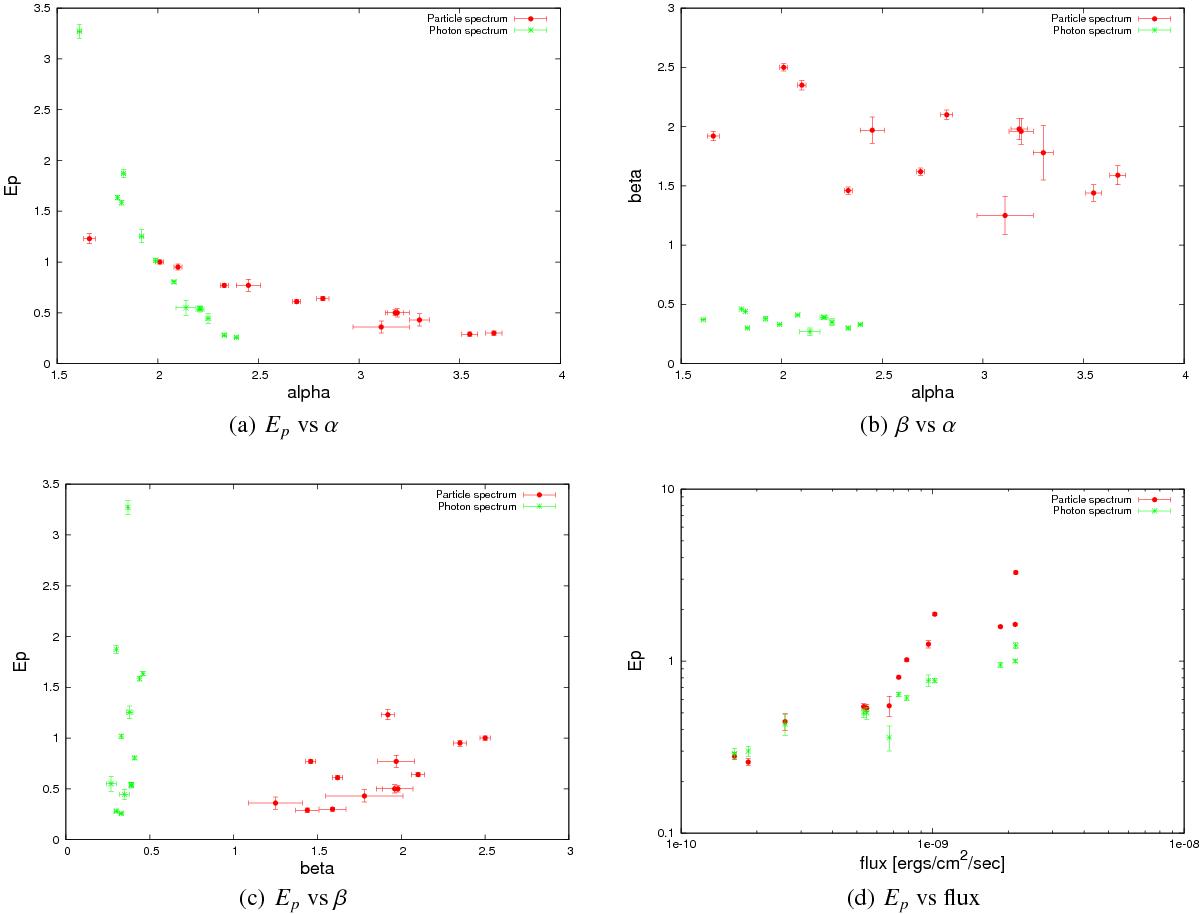
Cross plot of parameters for the logparabolic photon (green stars) and particle (red circles) spectrum. The peak curvature Ep clearly anti-correlates with alpha and strongly correlates with the flux. However, there is no correlation between Ep and the curvature parameter β, or between β and α.
This figure is made of several images, please see below:
Current usage metrics show cumulative count of Article Views (full-text article views including HTML views, PDF and ePub downloads, according to the available data) and Abstracts Views on Vision4Press platform.
Data correspond to usage on the plateform after 2015. The current usage metrics is available 48-96 hours after online publication and is updated daily on week days.
Initial download of the metrics may take a while.