Free Access
Fig. 9
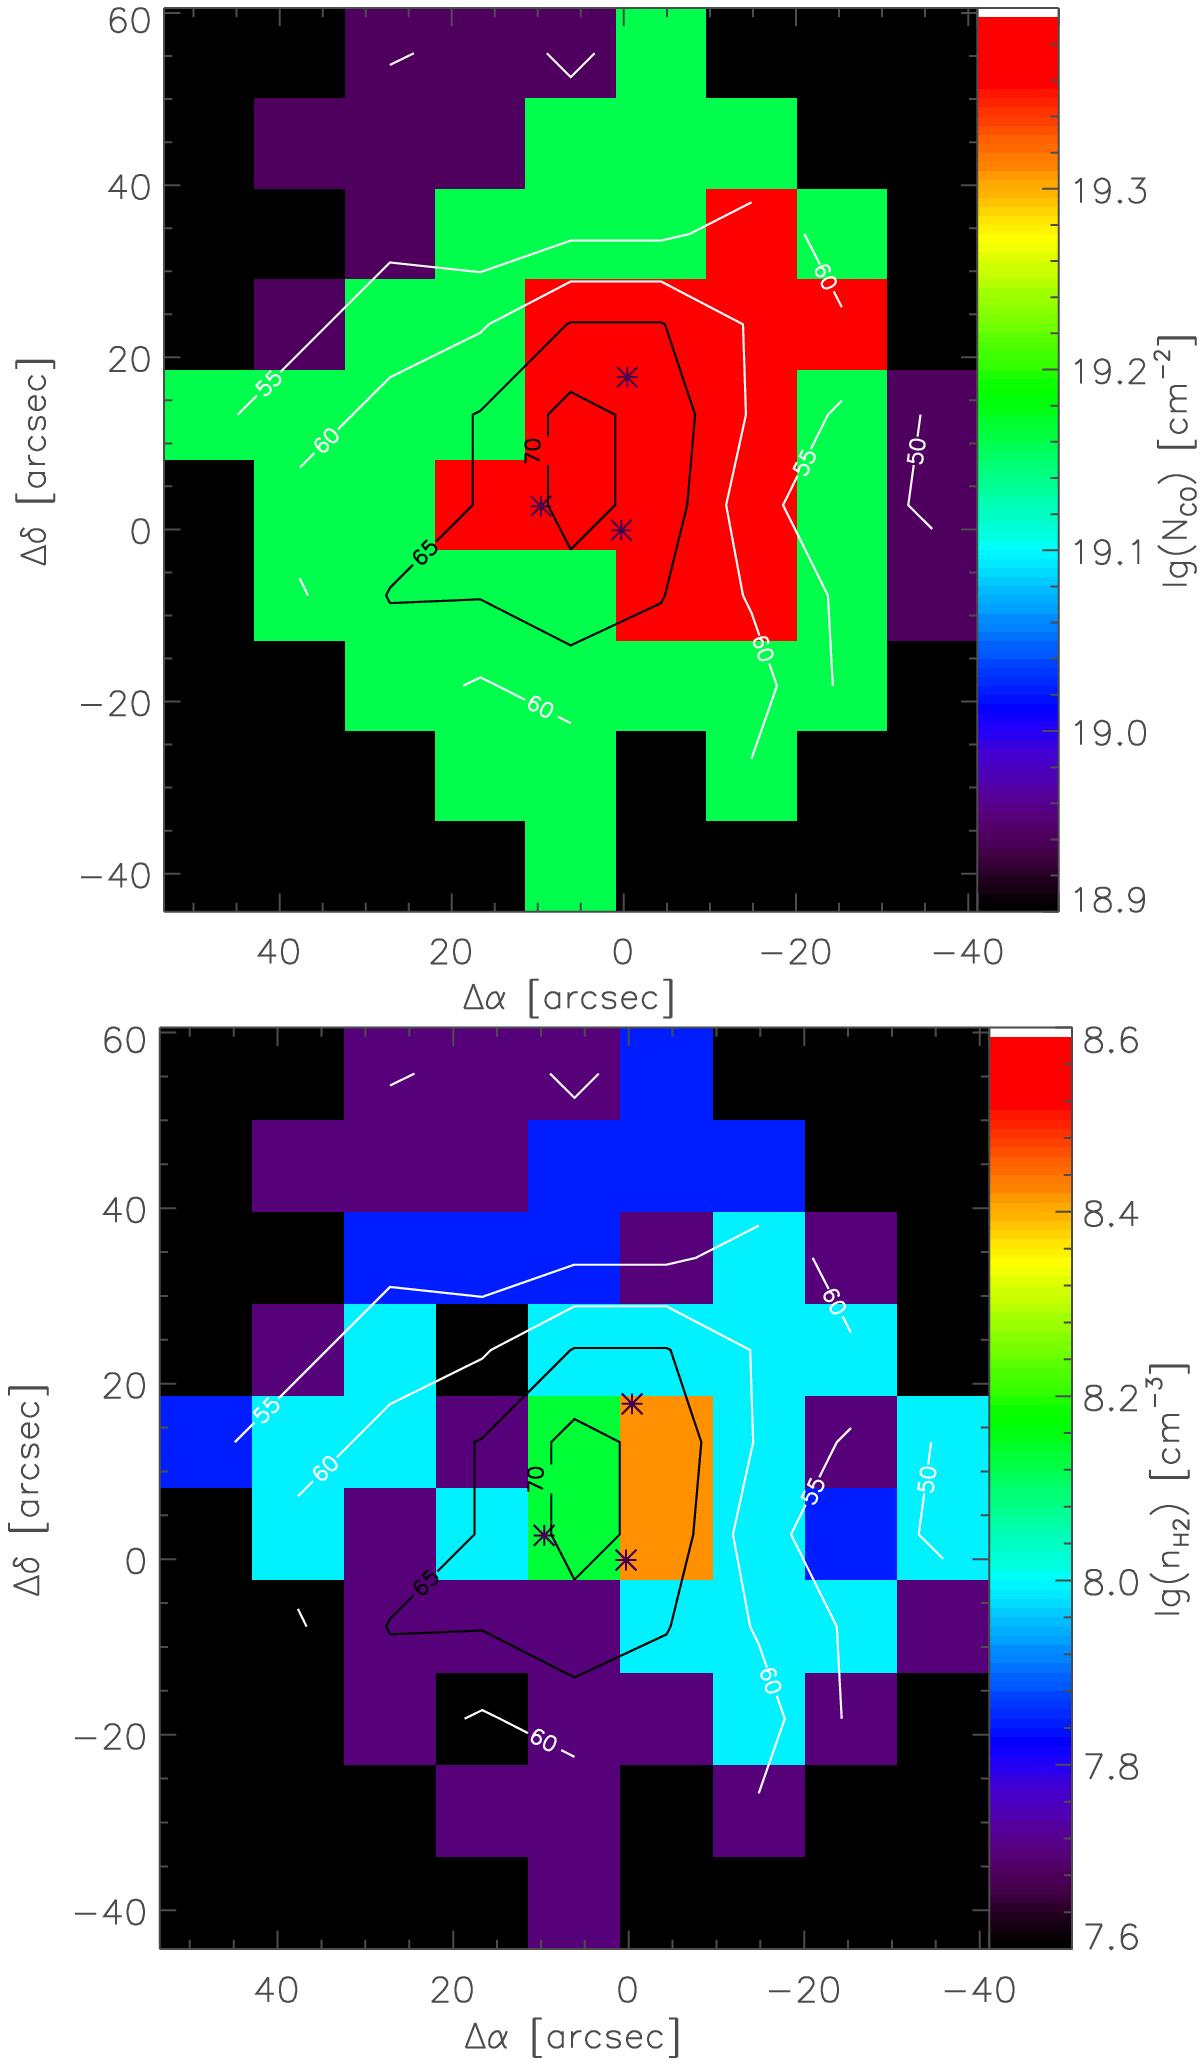
CO column density (upper plot: colors), gas density (lower plot: colors), and kinetic temperature (both plots: contours) derived from the RADEX fit of the integrated intensities of the observed lines of CO 1−0, 2−1, and 16−15 and the isotopologues 13CO 1−0 and C18O 1−0.
This figure is made of several images, please see below:
Current usage metrics show cumulative count of Article Views (full-text article views including HTML views, PDF and ePub downloads, according to the available data) and Abstracts Views on Vision4Press platform.
Data correspond to usage on the plateform after 2015. The current usage metrics is available 48-96 hours after online publication and is updated daily on week days.
Initial download of the metrics may take a while.