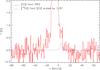
Fig. 7
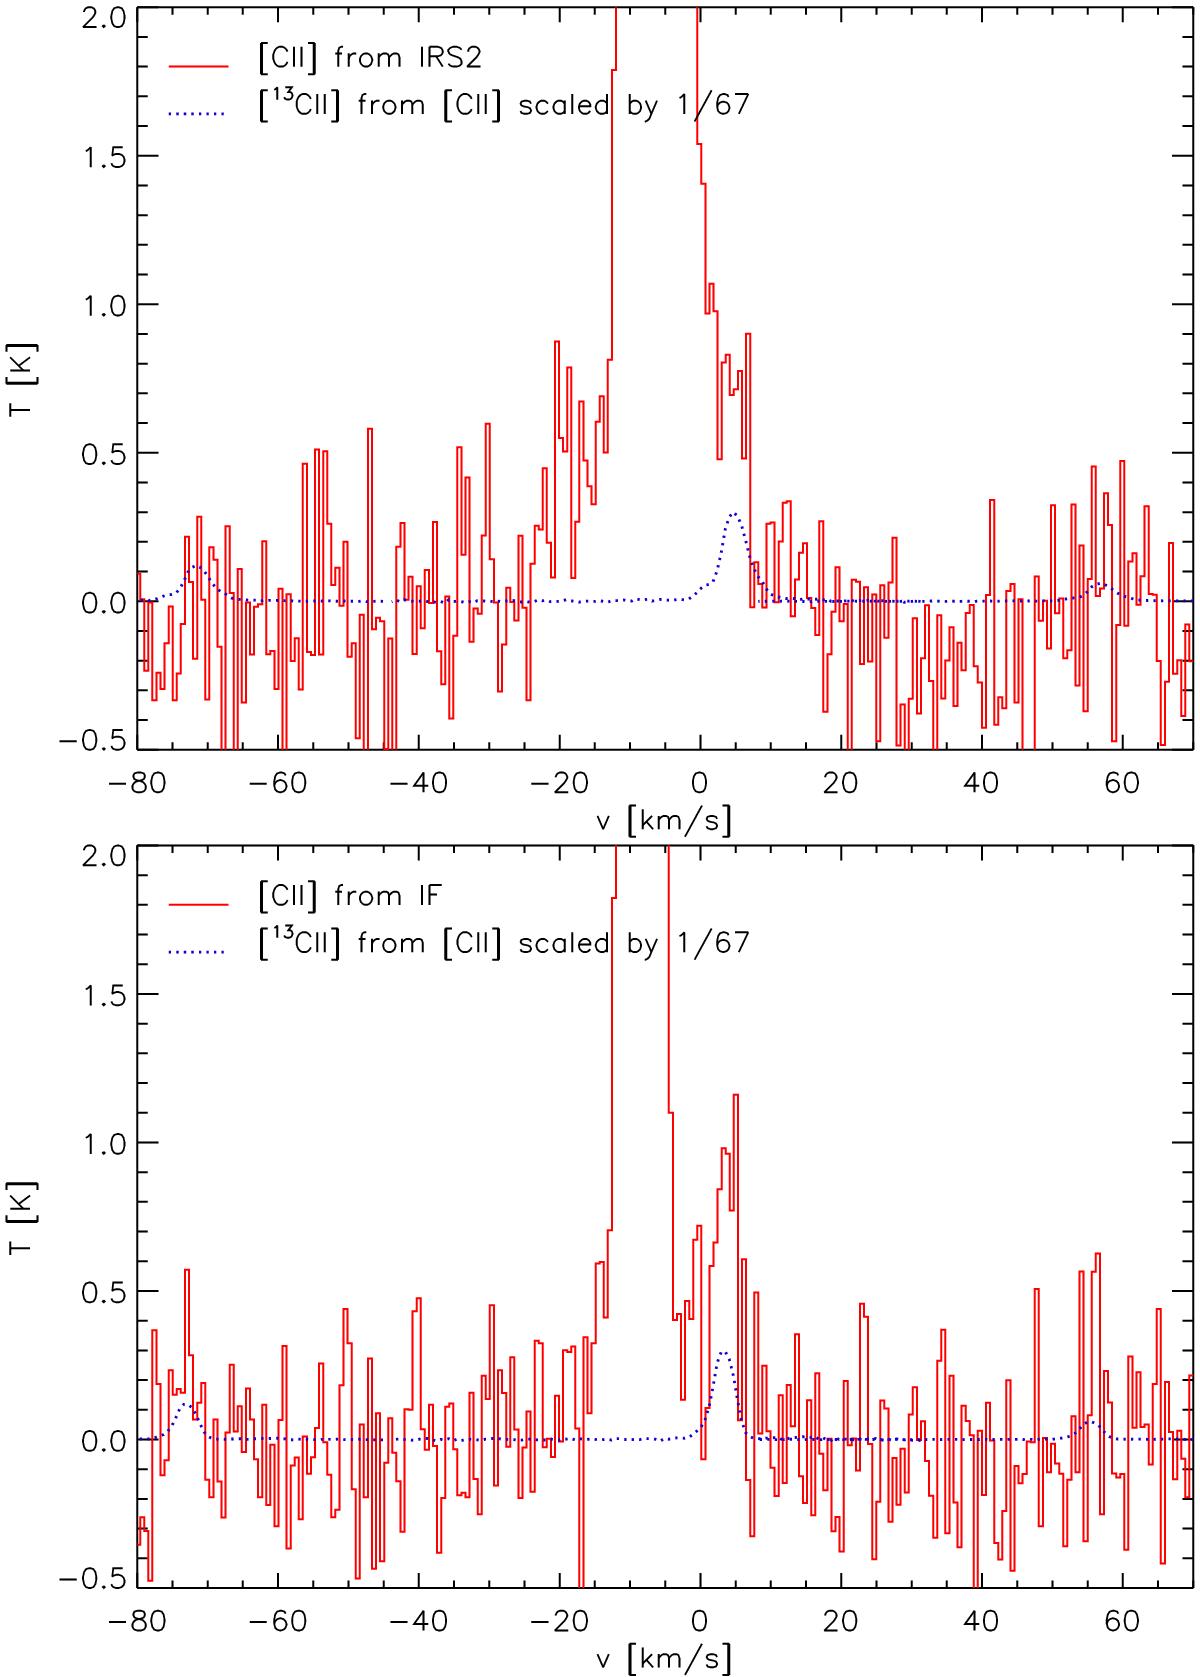
Baseline of the [C ii] profiles showing the hyperfine components of the [13C ii] transitions. The upper plot shows the sum spectrum from all spectra with integrated intensities above 100 K km s-1 from the IRS 1-3 region, the lower plot from the interface region. The blue lines represent the same spectra scaled by an abundance ratio of 1/67 and the corresponding line ratio and frequency of the three hyperfine transitions, i.e. they represent the spectrum that we expect in the case of an optically thin [C ii] line.
Current usage metrics show cumulative count of Article Views (full-text article views including HTML views, PDF and ePub downloads, according to the available data) and Abstracts Views on Vision4Press platform.
Data correspond to usage on the plateform after 2015. The current usage metrics is available 48-96 hours after online publication and is updated daily on week days.
Initial download of the metrics may take a while.