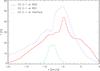
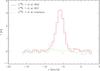
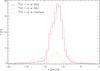
Fig. 6
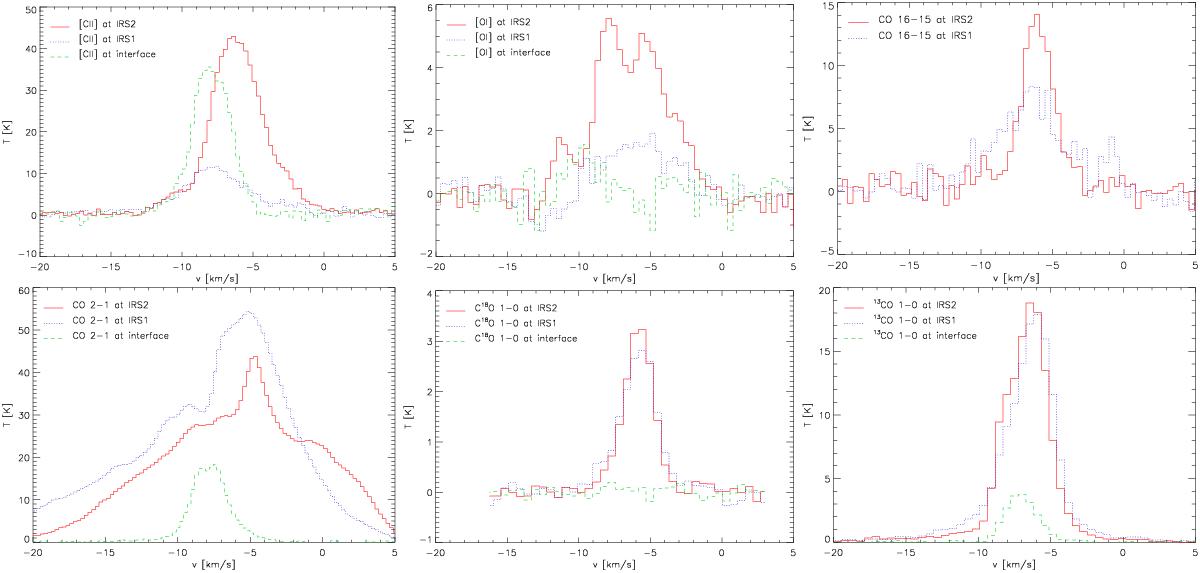
Line profiles of the [C ii], [O i], CO 16−15, CO 2−1, C18O 1−0, and 13CO 1−0 lines at the position of the [O i] peak (0, 20 close to IRS 2), at IRS 1 (0, 0), and at the interface (−40, −54). The lines are averaged in a Gaussian beam of 17.3′′ FWHM (telescope + convolution kernel) except for the 13CO and C18O lines that can only be treated at the lower resolution of 23′′.
Current usage metrics show cumulative count of Article Views (full-text article views including HTML views, PDF and ePub downloads, according to the available data) and Abstracts Views on Vision4Press platform.
Data correspond to usage on the plateform after 2015. The current usage metrics is available 48-96 hours after online publication and is updated daily on week days.
Initial download of the metrics may take a while.