Fig. 5
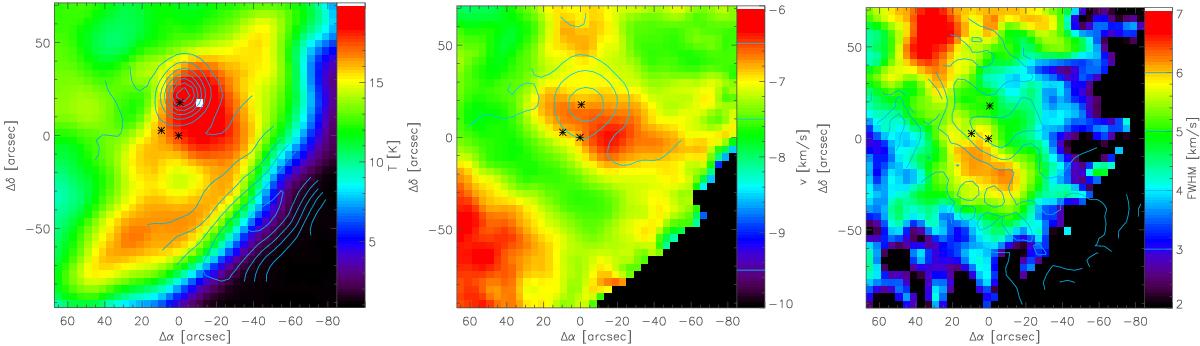
Peak intensity, first moment (centroid velocity), and second moment (translated to FWHM) of the lines of 13CO 1−0 (colors) and [C ii] contours. The black marks indicate the positions of IRS 1-3. The contour levels for the [C ii] peak intensity match those from Fig. 2; for the line position they are given at −9.5, −8.5, −7.5, and −6.5 km s-1, and for the line width at 3, 4, 5, and 6 km s-1. Velocities are given in LSR (local standard of rest) and intensities in main beam temperatures.
Current usage metrics show cumulative count of Article Views (full-text article views including HTML views, PDF and ePub downloads, according to the available data) and Abstracts Views on Vision4Press platform.
Data correspond to usage on the plateform after 2015. The current usage metrics is available 48-96 hours after online publication and is updated daily on week days.
Initial download of the metrics may take a while.