Free Access
Fig. 3
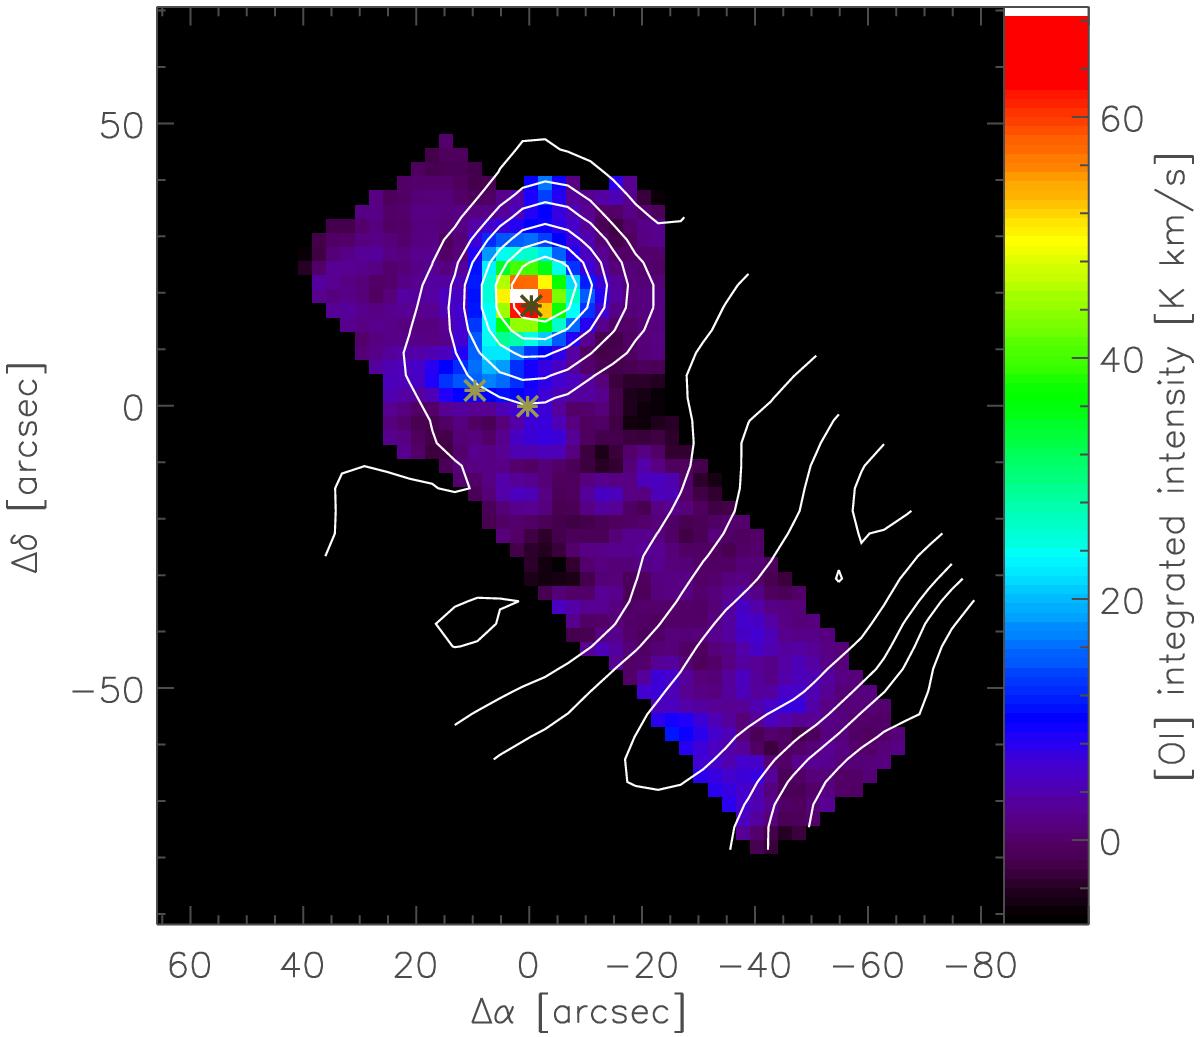
Integrated intensity map of the [O i] 63 μm line (colors) overlaid by contours of the [C ii] integrated intensity (levels as in Fig. 1). The three marks indicate the positions of IRS 1-3. All coordinates are taken relative to the position of IRS 1 at ![]() , Dec
, Dec ![]() (J2000).
(J2000).
Current usage metrics show cumulative count of Article Views (full-text article views including HTML views, PDF and ePub downloads, according to the available data) and Abstracts Views on Vision4Press platform.
Data correspond to usage on the plateform after 2015. The current usage metrics is available 48-96 hours after online publication and is updated daily on week days.
Initial download of the metrics may take a while.