Fig. A.4
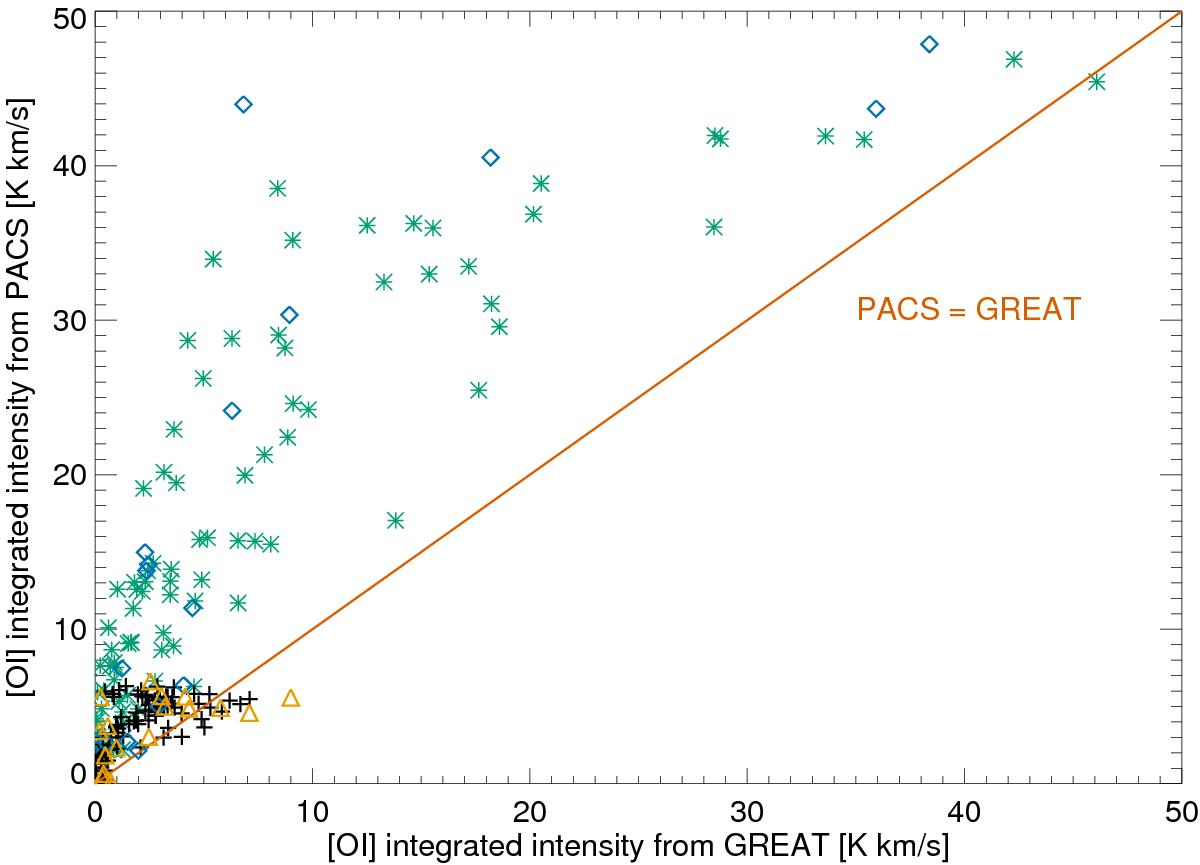
Measured intensities in the different pixels of Fig. A.3 as seen by GREAT and PACS. Green asterisks represent the footprint around IRS 1 and black plus signs the footprint at the outer interface when both data sets are resampled to a common 12′′ resolution (Fig. A.3b). Blue diamonds and orange triangles are obtained when we resample the GREAT data to the 25 pixels of the PACS array using the 9′′ PSF of PACS for the IRS 1 region and the interface, respectively (Fig. A.3a). The brown line shows the identity.
Current usage metrics show cumulative count of Article Views (full-text article views including HTML views, PDF and ePub downloads, according to the available data) and Abstracts Views on Vision4Press platform.
Data correspond to usage on the plateform after 2015. The current usage metrics is available 48-96 hours after online publication and is updated daily on week days.
Initial download of the metrics may take a while.