Free Access
Fig. 2
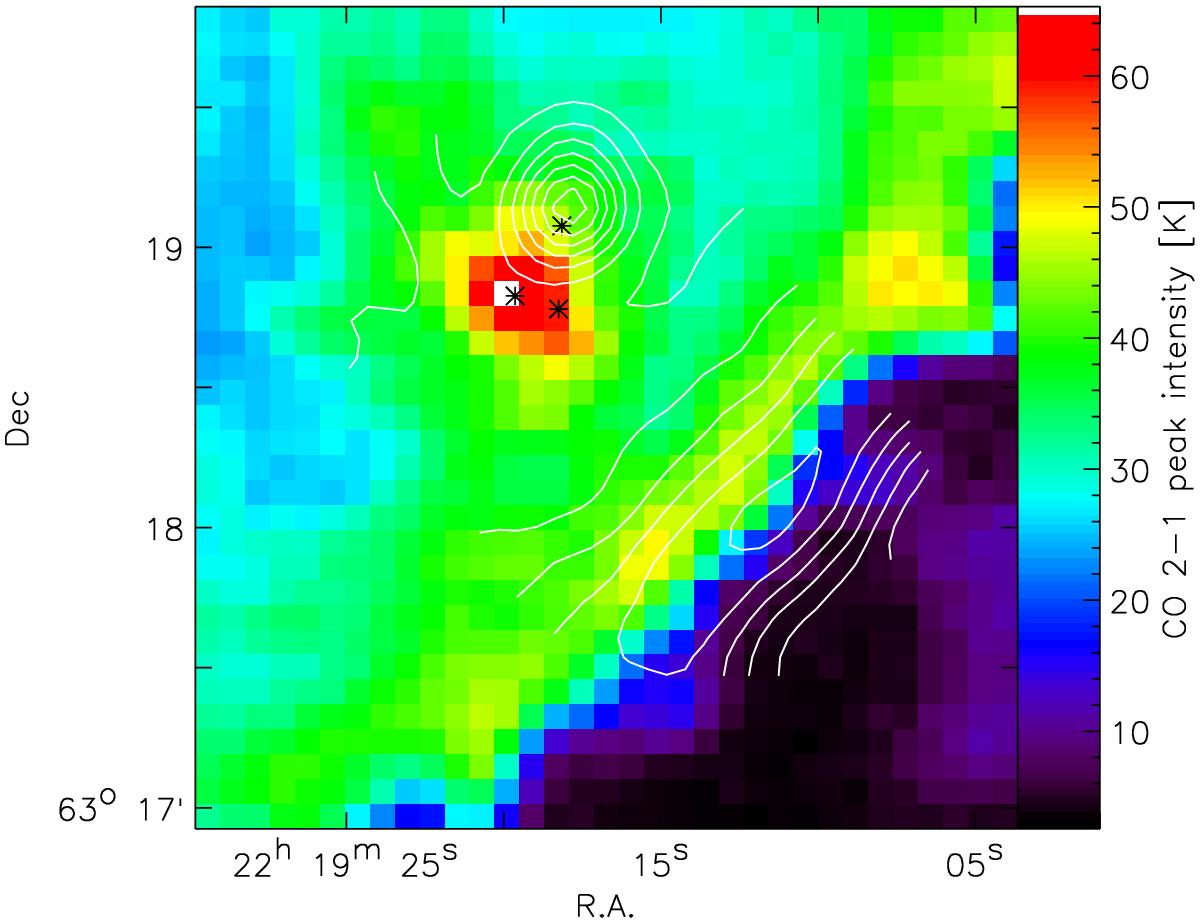
Peak intensity map of [C ii] overlaid on a IRAM 30 m map of the CO 2−1 peak intensity. The [C ii] contours are drawn at 15, 20, 25, 30, 35, 40, and 45 K. The black marks indicate the positions of IRS 1-3.
Current usage metrics show cumulative count of Article Views (full-text article views including HTML views, PDF and ePub downloads, according to the available data) and Abstracts Views on Vision4Press platform.
Data correspond to usage on the plateform after 2015. The current usage metrics is available 48-96 hours after online publication and is updated daily on week days.
Initial download of the metrics may take a while.