Fig. A.3
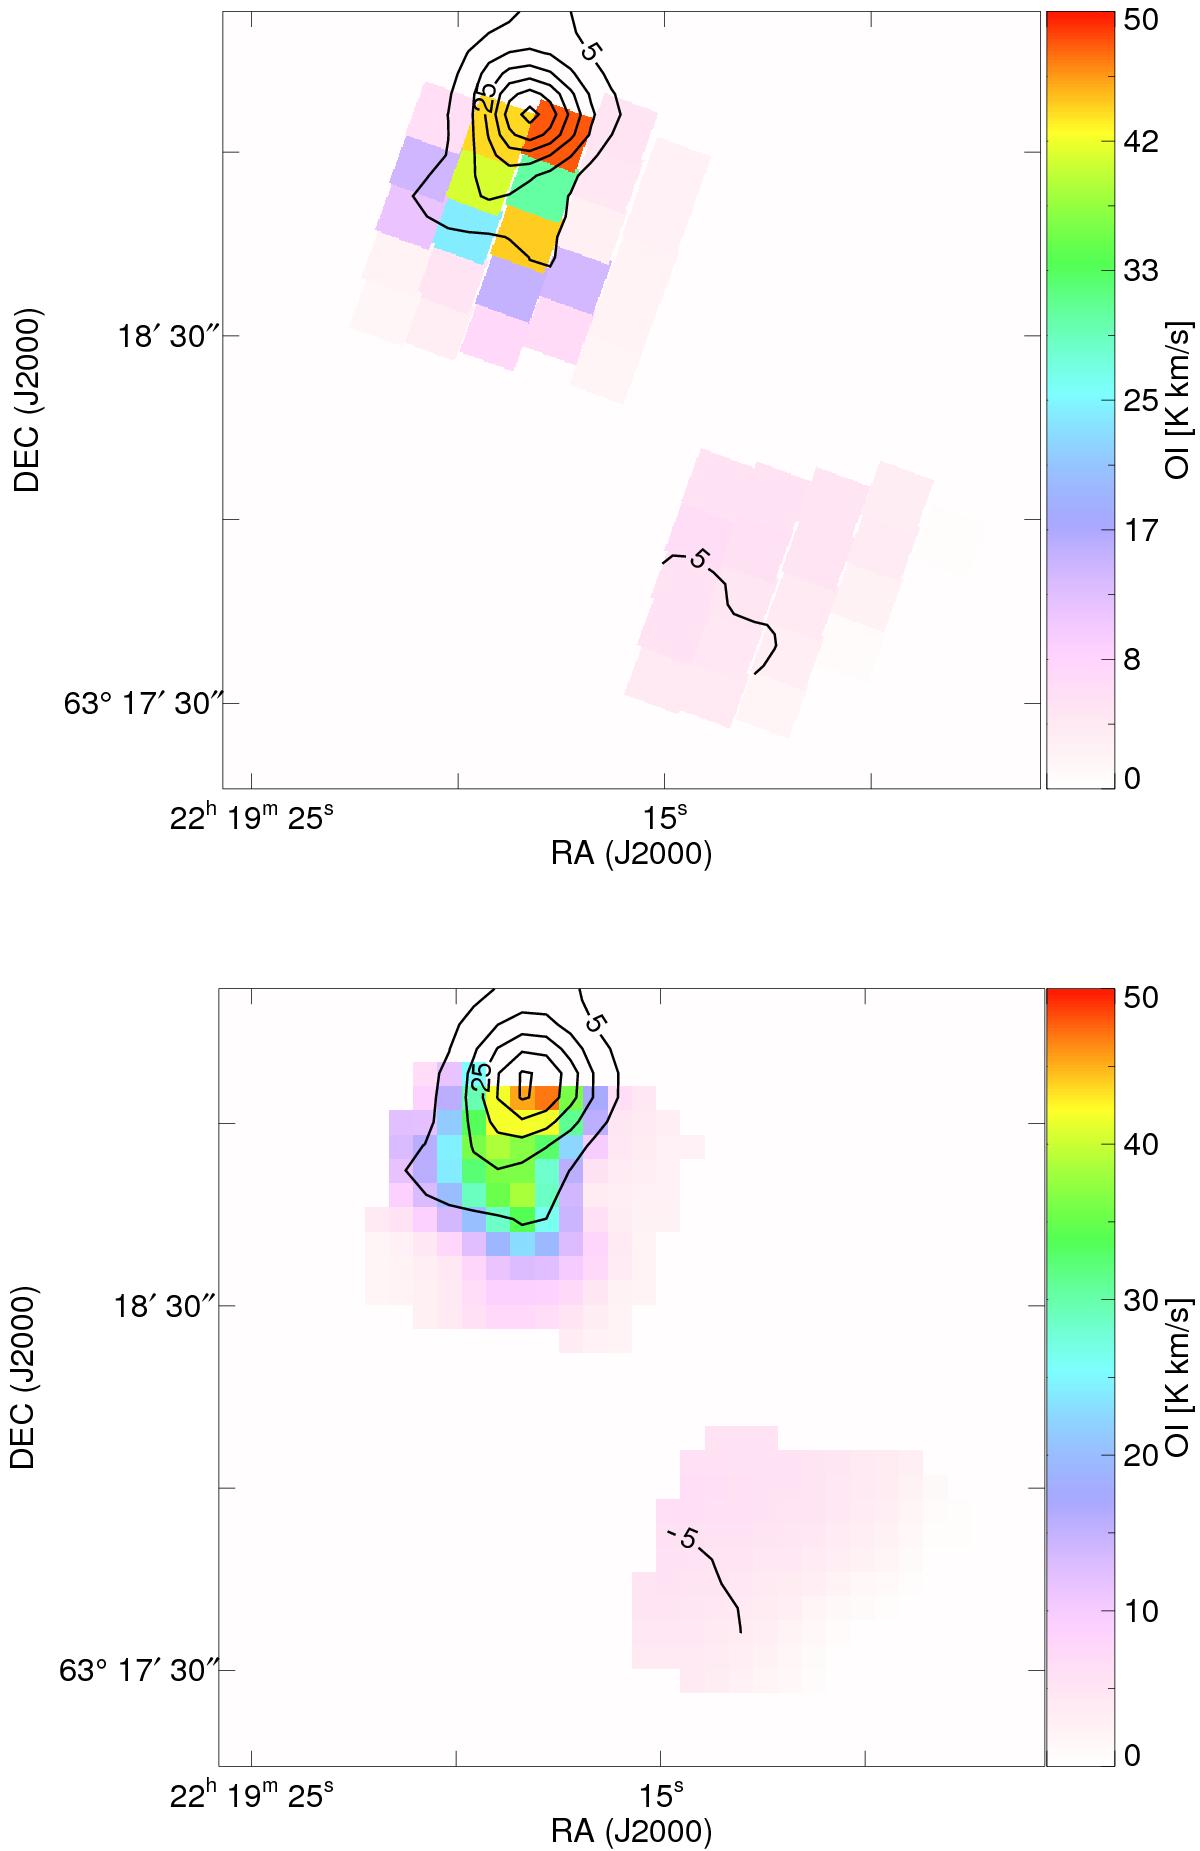
Integrated map of [O i] obtained in the GREAT observations (contours) overlaid on the colors of the [O i] line intensity from the two PACS footprints. The top image shows the intensities in the original PACS footprints with GREAT data convolved to 10′′ resolution. In the bottom version both maps are resampled to the positions of the GREAT map for the effective resolution of a circular 12′′ beam.
Current usage metrics show cumulative count of Article Views (full-text article views including HTML views, PDF and ePub downloads, according to the available data) and Abstracts Views on Vision4Press platform.
Data correspond to usage on the plateform after 2015. The current usage metrics is available 48-96 hours after online publication and is updated daily on week days.
Initial download of the metrics may take a while.