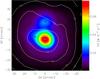
Fig. 15
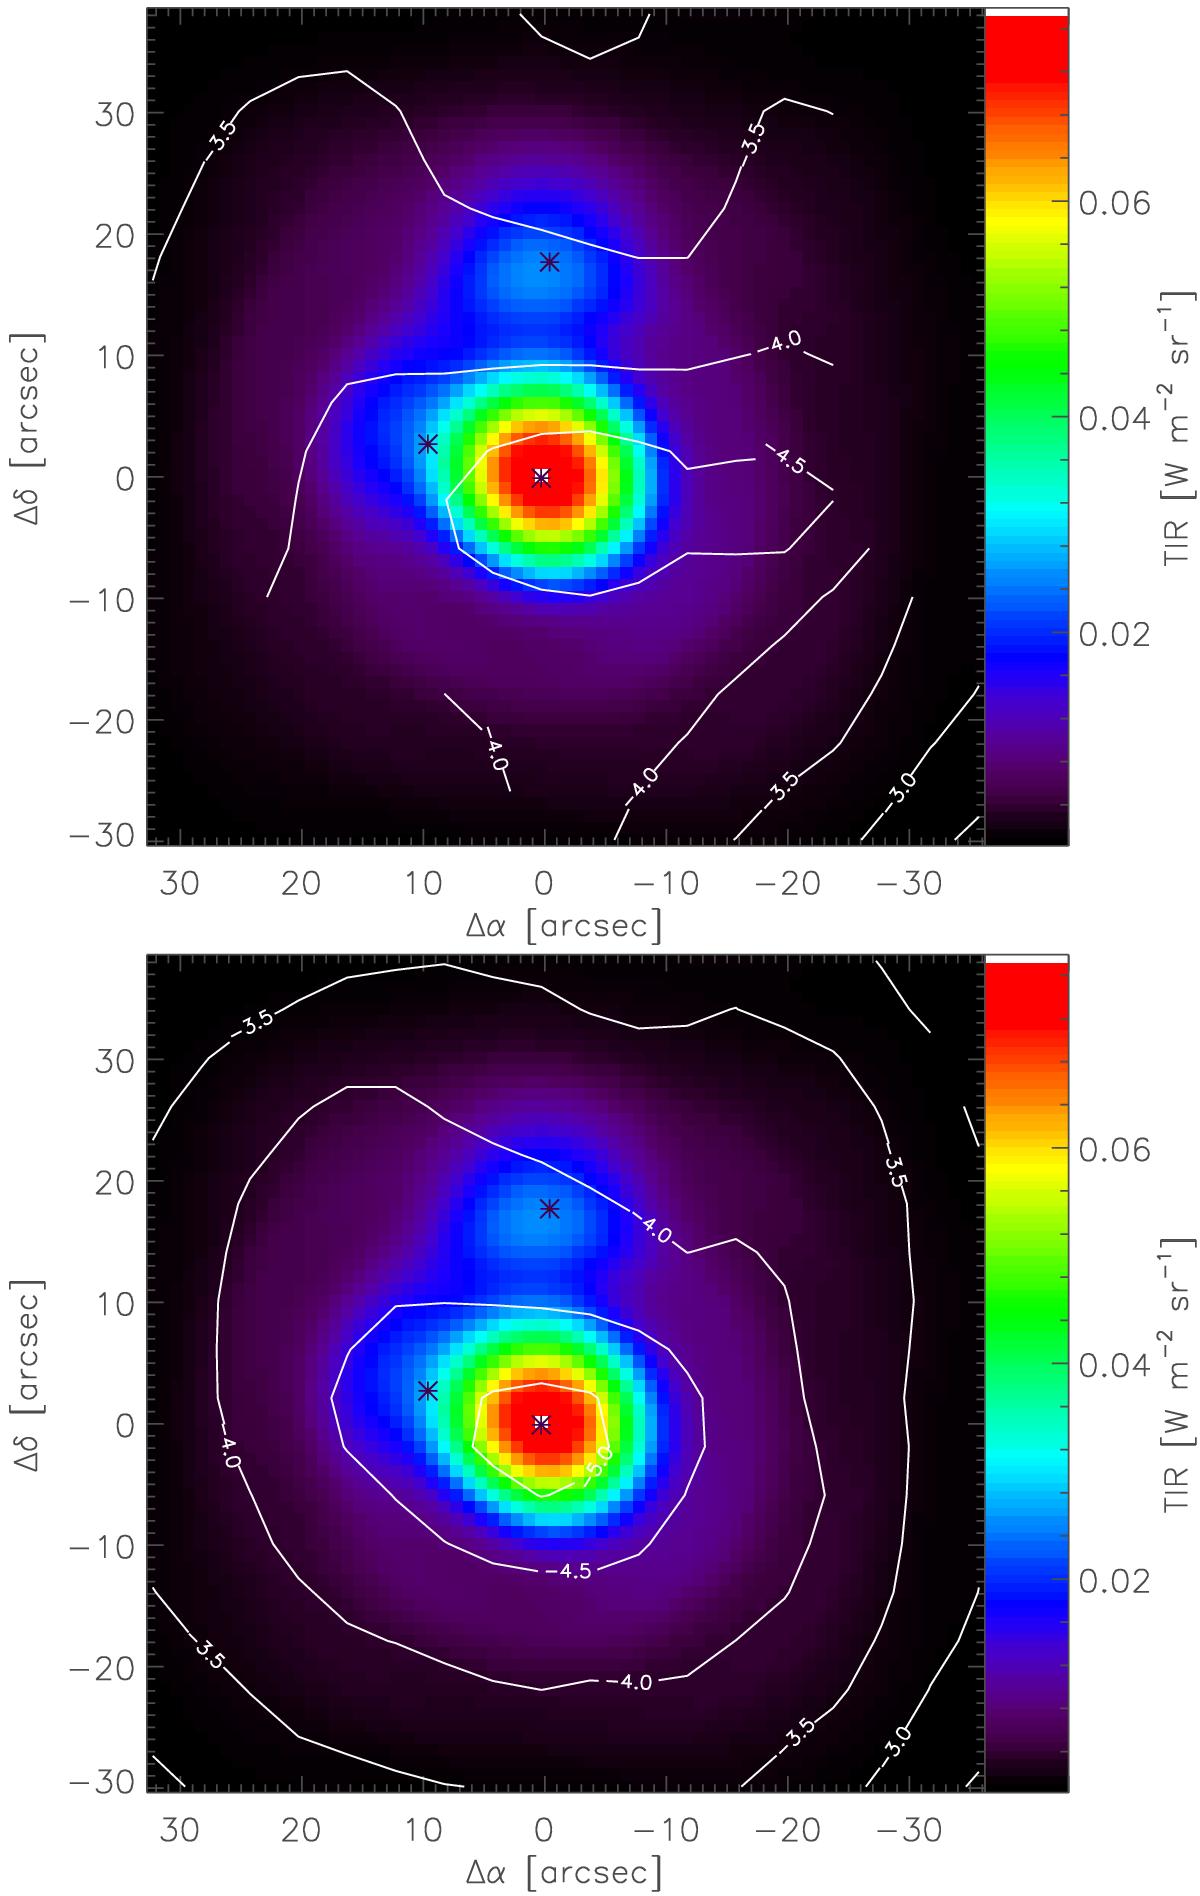
Comparison of the line cooling with the infrared continuum cooling. The background colors show the total infrared flux integrated from wavelengths starting at 11 μm (Koumpia et al. 2015). The contours give the decadic logarithm of the ratio of the integrated line flux relative to the continuum flux. In the top panel we use the sum of the [O i] and [C ii] fluxes, in the lower panel, we only show the [C ii]/TIR ratio as used in many existing investigations.

Current usage metrics show cumulative count of Article Views (full-text article views including HTML views, PDF and ePub downloads, according to the available data) and Abstracts Views on Vision4Press platform.
Data correspond to usage on the plateform after 2015. The current usage metrics is available 48-96 hours after online publication and is updated daily on week days.
Initial download of the metrics may take a while.