Free Access
Fig. 12
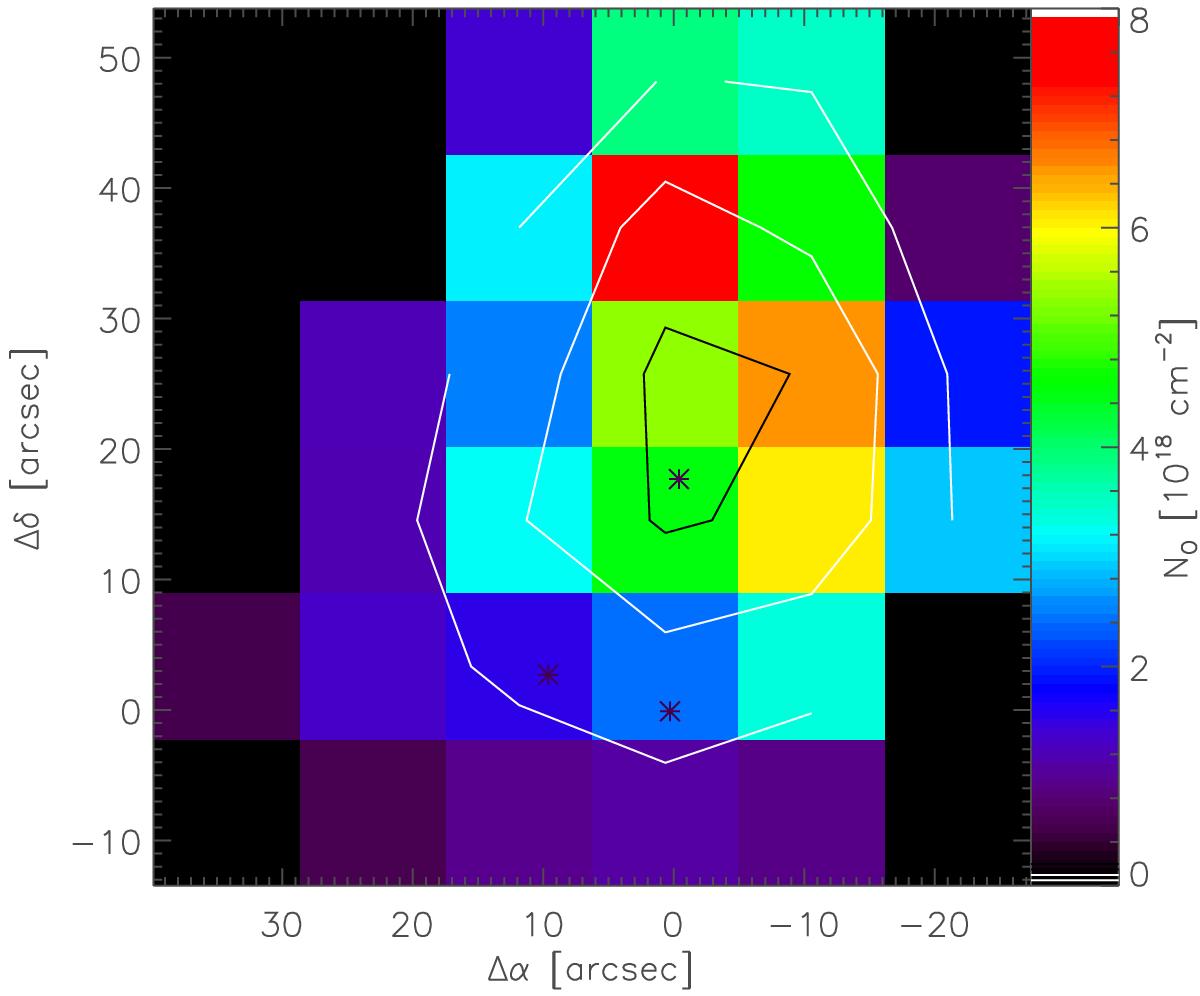
Column density map of atomic oxygen derived from the measured [O i] intensities using the gas parameters from the RADEX fit to the CO lines. The contours show the [O i] line optical depth at levels of τ = 0.05,0.10,0.15,0.20.
Current usage metrics show cumulative count of Article Views (full-text article views including HTML views, PDF and ePub downloads, according to the available data) and Abstracts Views on Vision4Press platform.
Data correspond to usage on the plateform after 2015. The current usage metrics is available 48-96 hours after online publication and is updated daily on week days.
Initial download of the metrics may take a while.