Fig. 1
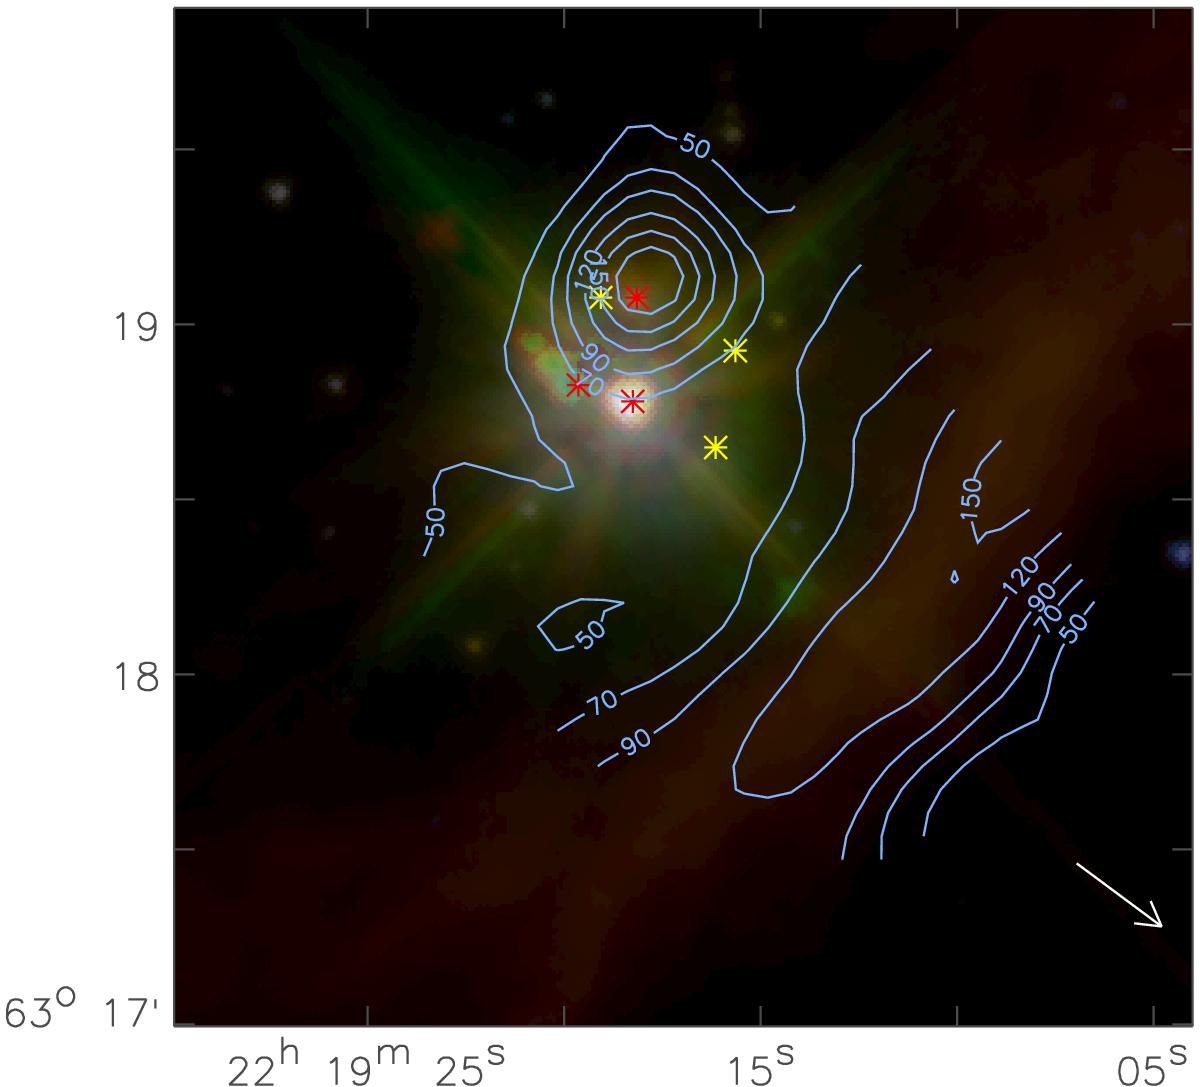
Integrated intensity map of [C ii] overlaid on a Spitzer IRAC false-color image of the same region. The IRAC map uses the logarithmic intensities of the 3.6, 5.6, and 8μm channels. The integrated intensity contours are drawn at 50, 70, 90, 120, 150, and 180 K km s-1. The external cloud interface is visible in the southwest. The arrow shows the direction towards the illuminating source HD 211880. The red marks indicate the position of the known infrared sources: southwest is IRS 1, north is IRS 2, and southeast is IRS 3 (Evans et al. 1989), the yellow marks show the position of known submm cores (Minchin et al. 1995; Maud et al. 2013). The IRAC peak falls at the location of IRS 1.
Current usage metrics show cumulative count of Article Views (full-text article views including HTML views, PDF and ePub downloads, according to the available data) and Abstracts Views on Vision4Press platform.
Data correspond to usage on the plateform after 2015. The current usage metrics is available 48-96 hours after online publication and is updated daily on week days.
Initial download of the metrics may take a while.