Fig. 3
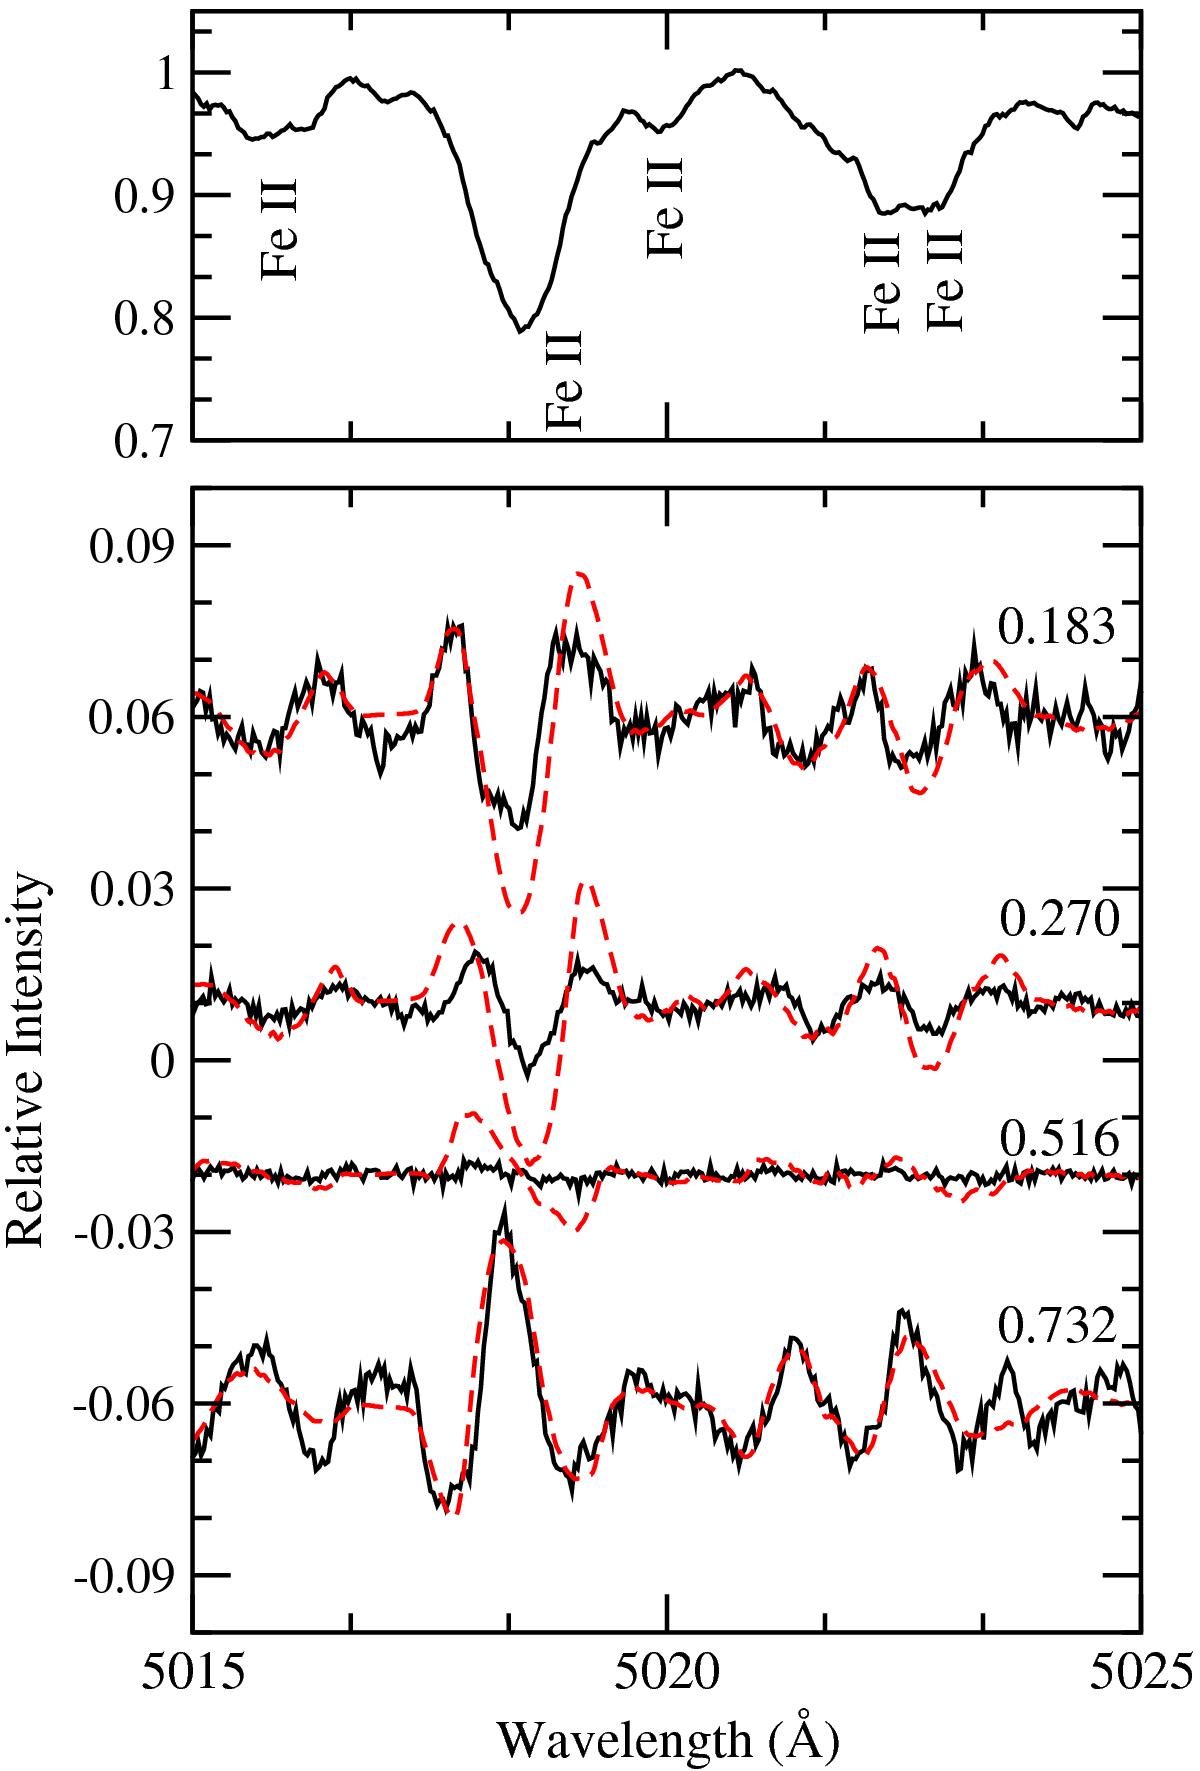
Phase-resolved Stokes V spectra for HD 133652. The solid black lines are the observed spectra and the dashed red lines are the synthetic spectra using the adopted field geometry (see Table 1). The rotational phases are labelled. The top panel is the Stokes I signature for the same spectral window for one of the ESPaDoNS observations (φ = 0.183). Note that the negative and positive magnetic poles pass closest to the line of sight at phases 0.0 and 0.5, respectively.
Current usage metrics show cumulative count of Article Views (full-text article views including HTML views, PDF and ePub downloads, according to the available data) and Abstracts Views on Vision4Press platform.
Data correspond to usage on the plateform after 2015. The current usage metrics is available 48-96 hours after online publication and is updated daily on week days.
Initial download of the metrics may take a while.