Fig. 3
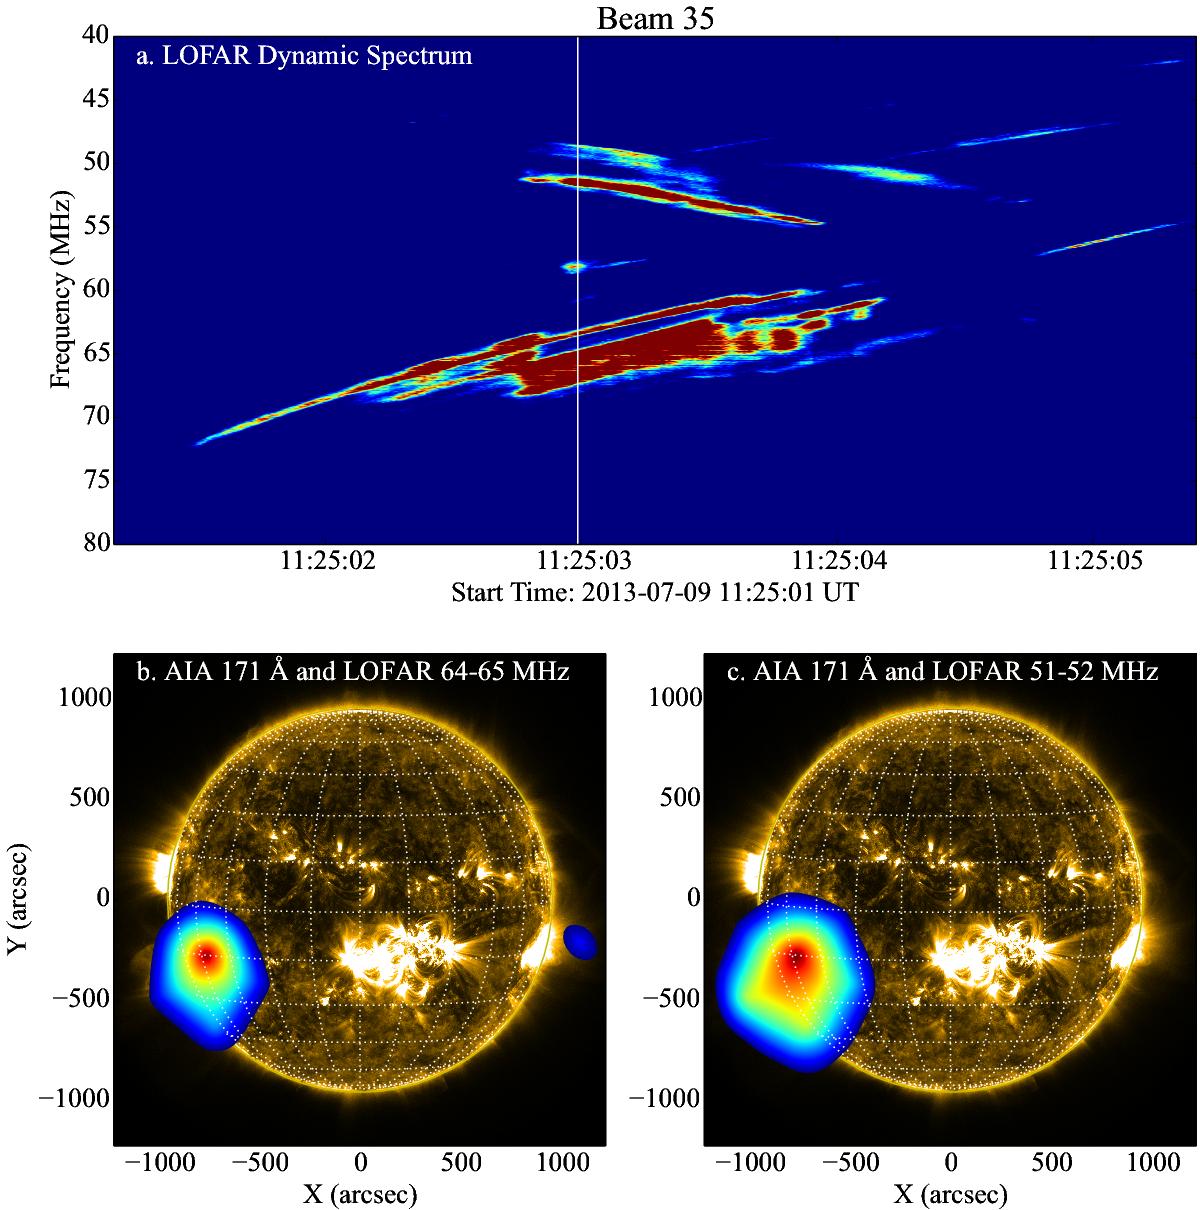
Location of S bursts at two separate frequencies. a) LOFAR 4 s dynamic spectrum showing negatively and positively drifting S bursts. The white line marks the timestamp in the images below. b) SDO/AIA 171 Å image at 11:25:11 UT and the overlaid LOFAR source of the negative drifting S burst at a frequency of 64−65 MHz at the time marked by the white line in a). c) SDO/AIA 171 Å image 11:25:11 UT and the overlaid LOFAR source of the positive drifting S bursts at a frequency of 51−52 MHz at the time marked by the white line in a). An animation of the temporal evolution is available in the online edition.
Current usage metrics show cumulative count of Article Views (full-text article views including HTML views, PDF and ePub downloads, according to the available data) and Abstracts Views on Vision4Press platform.
Data correspond to usage on the plateform after 2015. The current usage metrics is available 48-96 hours after online publication and is updated daily on week days.
Initial download of the metrics may take a while.