Fig. 1
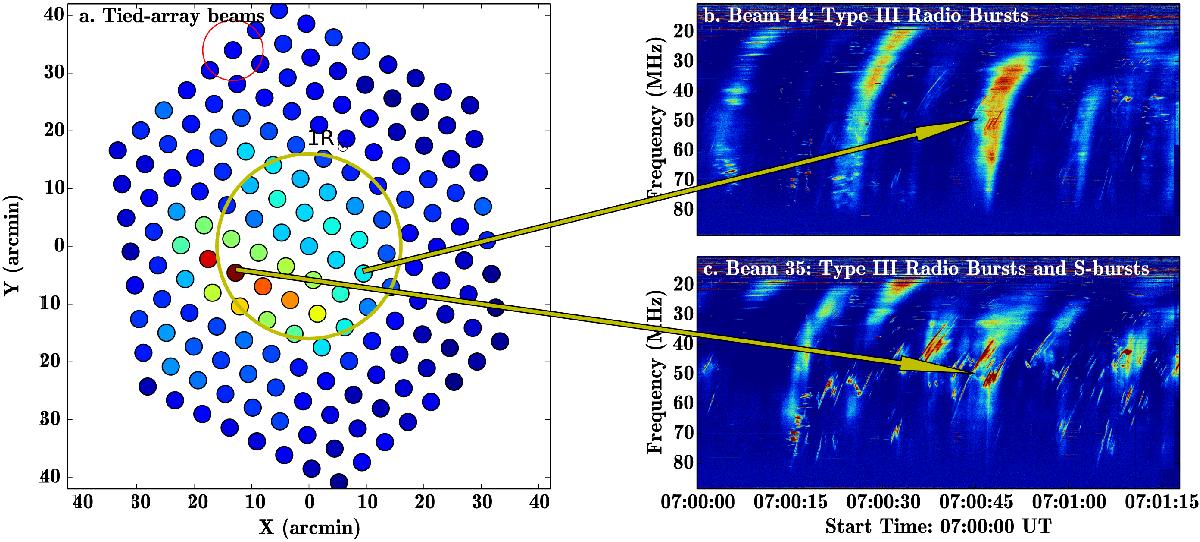
LOFAR tied-array beam observations of Type III radio bursts and solar S bursts. a) Map of 170 tied-array beams covering a field-of-view of ~1.3° about the Sun. The full-width half-maximum (FWHM) of the beams at zenith at a frequency of 60 MHz is represented by the red circle and the size of the optical Sun is represented by the yellow circle. b) Dynamic spectrum recorded for a period of 1.3 min corresponding to Beam 14 containing Type III radio bursts. c) Dynamic spectrum recorded for a period of 1.3 min corresponding to Beam 35 containing Type III radio bursts and S bursts. The two arrows indicate the beams that recorded the two dynamic spectra in b) and c) pointing at the time and frequency corresponding to the intensity values in a).
Current usage metrics show cumulative count of Article Views (full-text article views including HTML views, PDF and ePub downloads, according to the available data) and Abstracts Views on Vision4Press platform.
Data correspond to usage on the plateform after 2015. The current usage metrics is available 48-96 hours after online publication and is updated daily on week days.
Initial download of the metrics may take a while.