Fig. 7
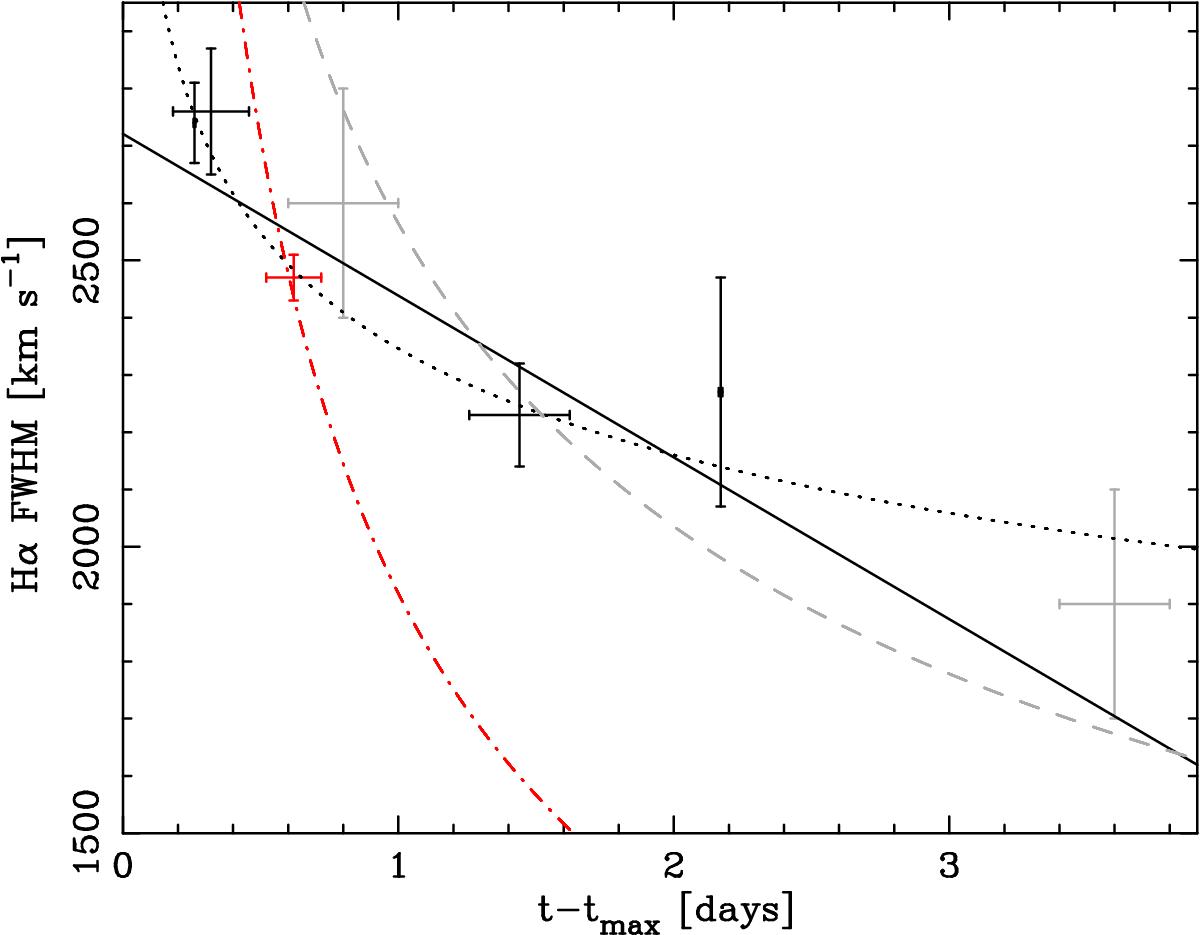
Evolution of the FWHM of the Hα emission line following the eruption of M31N 2008-12a. Black points indicate WHT and LT spectra from the 2014 eruption, grey points are from the 2013 eruption (TBW14), and the red point is from the HET spectra in 2012 (DWB14). The solid black line shows a simple linear least-squares fit to the 2012, 2013, and 2014 data (gradient = − 280 ± 50 km s-1 day-1), the grey dashed line a power-law of index −1/3, the red dot-dashed line a power-law of index −1/2, and the black dotted line the best fit power-law with index −0.12 ± 0.05, see the text for details.
Current usage metrics show cumulative count of Article Views (full-text article views including HTML views, PDF and ePub downloads, according to the available data) and Abstracts Views on Vision4Press platform.
Data correspond to usage on the plateform after 2015. The current usage metrics is available 48-96 hours after online publication and is updated daily on week days.
Initial download of the metrics may take a while.