Fig. 10
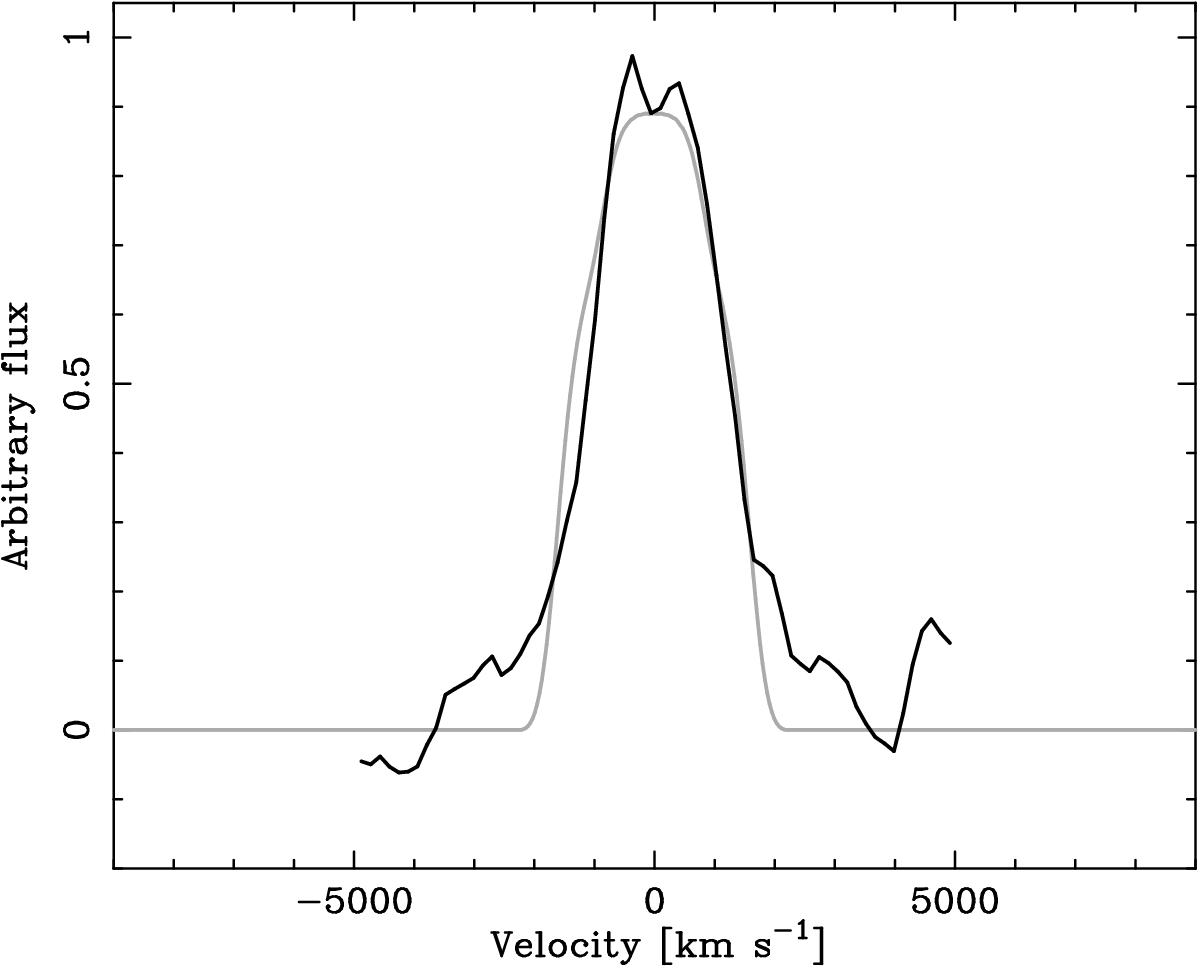
The solid black line shows the co-added spectra from the four epochs of 2014 observations and a single epoch of 2012 observations of the erupting M31N 2008-12a, centred on the Hα emission line, (the peak redwards of Hα is the He i (6678 Å) emission). The solid grey line indicates the best-fitting model spectrum expected by a freely expanding ejecta with a bi-polar morphology, see the text for further details and discussion.
Current usage metrics show cumulative count of Article Views (full-text article views including HTML views, PDF and ePub downloads, according to the available data) and Abstracts Views on Vision4Press platform.
Data correspond to usage on the plateform after 2015. The current usage metrics is available 48-96 hours after online publication and is updated daily on week days.
Initial download of the metrics may take a while.