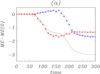
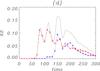
Fig. 6
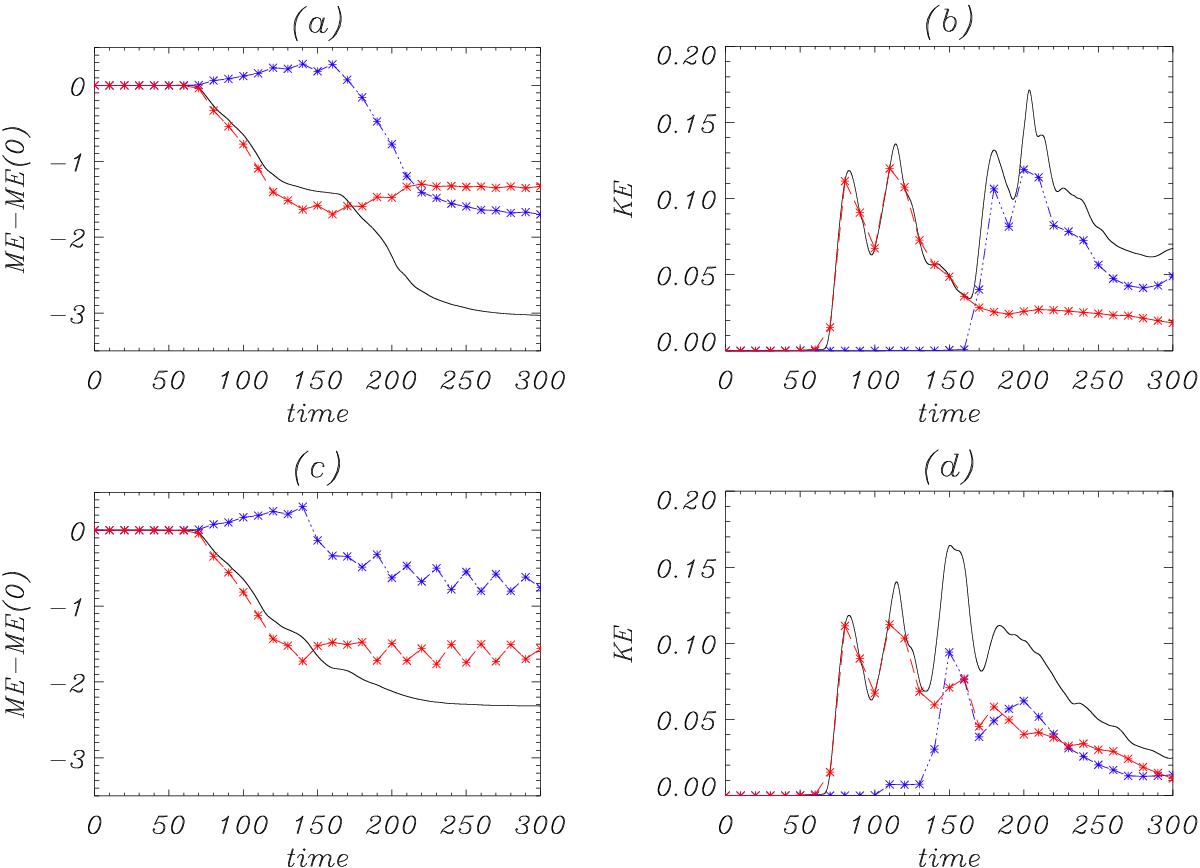
Temporal evolution of the volume integrated energy plots of a) the change in magnetic energy and b) the kinetic energy for Case 1 and c) the change in magnetic energy and d) the kinetic energy for Case 4. The magnetic energy at time t = 0 is 175.52 for Case 1 and 174.52 for Case 4. The black curves show the energy profiles as in Fig. 4, while the red curves show the energy profiles on the left-hand side of the domain and the blue curves for the left-hand side.
Current usage metrics show cumulative count of Article Views (full-text article views including HTML views, PDF and ePub downloads, according to the available data) and Abstracts Views on Vision4Press platform.
Data correspond to usage on the plateform after 2015. The current usage metrics is available 48-96 hours after online publication and is updated daily on week days.
Initial download of the metrics may take a while.