Fig. 2
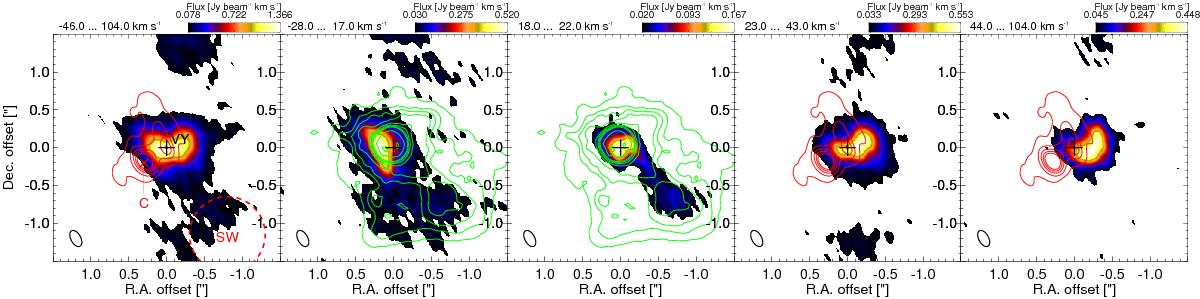
TiO2 morphology. Colour maps of emission at 310.78 GHz integrated over the νLSR-ranges indicated at the top left of each panel, cut off at 3σ. Red contours show the 321 GHz continuum at [3, 20, 40, 60, 80] σ; green contours show HST emission at [3, 5, 7, 10, 20, 30, 40, 50, 100, 200] σ (Smith et al. 2001). In the first panel we mark the position of the star (+, VY; black) and of the continuum component (x, C; red) to the south-east (O+15; R+14), and the position and approximate extent of the south-west clump (SW, dashed 1′′ diameter circle; red Shenoy et al. 2013). The apparent north-south emission is thought to arise from dynamic-range limitations in the peak channels.
Current usage metrics show cumulative count of Article Views (full-text article views including HTML views, PDF and ePub downloads, according to the available data) and Abstracts Views on Vision4Press platform.
Data correspond to usage on the plateform after 2015. The current usage metrics is available 48-96 hours after online publication and is updated daily on week days.
Initial download of the metrics may take a while.