Fig. 8
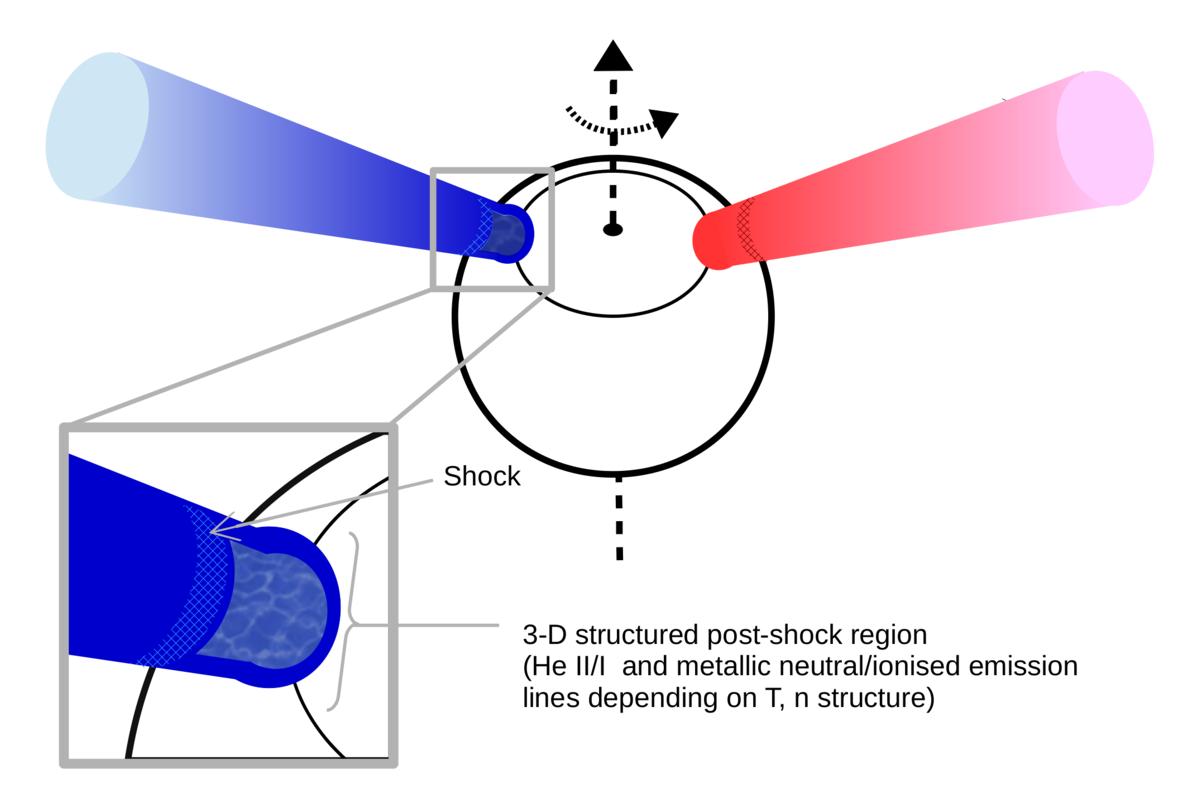
Cartoon of a star with an accretion column that is visible at all times due to the stellar inclination and whose emission lines suffer Doppler shift as the star rotates (the observer is located perpendicular to the plane of the paper). The blue (red) column shows the position at which the lines originated in it would appear blueshifted (redshifted) to an observer looking from out of the page. The hashed areas mark the shock region. We suggest that the observed narrow emission lines are produced in the post-shock area, which is stratified in density and temperature. Lines produced in the shock region (He II, requiring very hot and dense conditions) originate in a nearly flat structure, so their periodic signatures are much stronger and less messy than other lines produced in the extended, infalling post-shock region. The BC is produced in the accretion column before the pre-shock region, showing higher velocity offsets as they rotate with/around the star. Not to scale: we note that the shock region is at a very small distance over the photosphere, compared to the stellar radius.
Current usage metrics show cumulative count of Article Views (full-text article views including HTML views, PDF and ePub downloads, according to the available data) and Abstracts Views on Vision4Press platform.
Data correspond to usage on the plateform after 2015. The current usage metrics is available 48-96 hours after online publication and is updated daily on week days.
Initial download of the metrics may take a while.