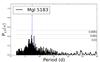
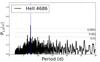
Fig. 5
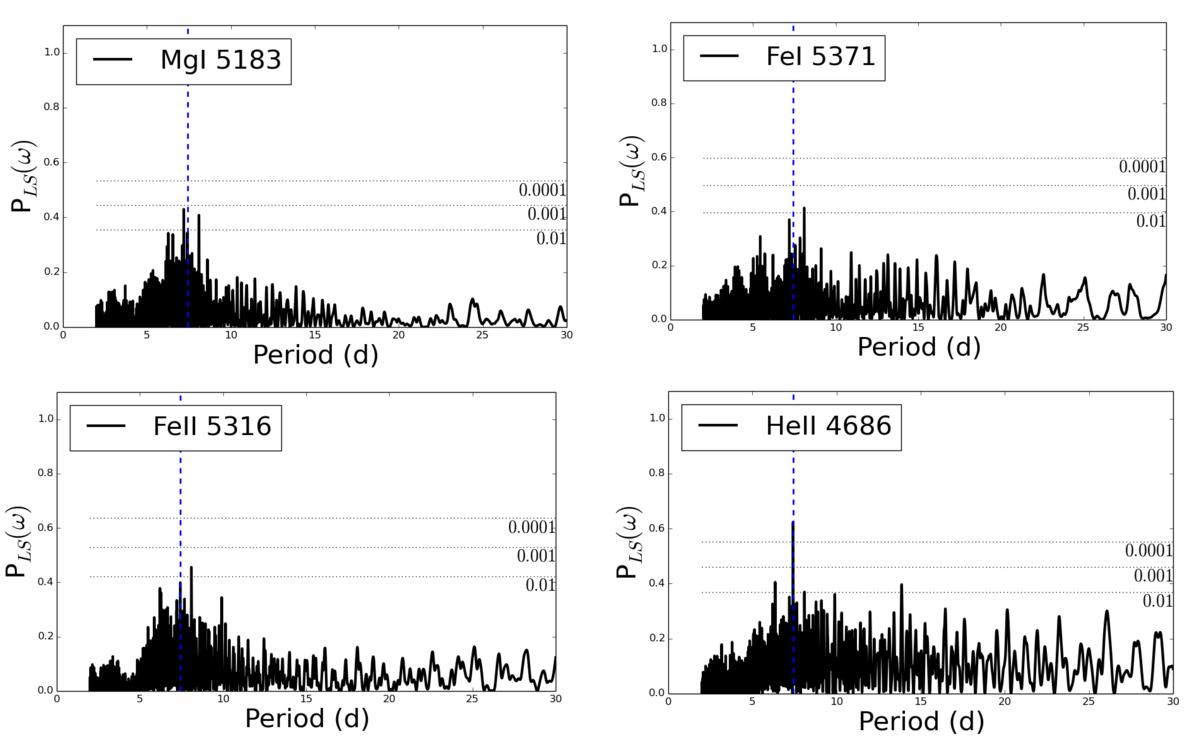
Some examples of GLS periodograms for different lines. The 7.41d period (marked as a blue dashed line) becomes increasingly significant as we move to lines with higher excitation potentials. The FAP are marked as dotted horizontal lines and labelled accordingly. The situation observed for Mg I is typical of the rest of metallic lines labelled as having several peaks.
Current usage metrics show cumulative count of Article Views (full-text article views including HTML views, PDF and ePub downloads, according to the available data) and Abstracts Views on Vision4Press platform.
Data correspond to usage on the plateform after 2015. The current usage metrics is available 48-96 hours after online publication and is updated daily on week days.
Initial download of the metrics may take a while.