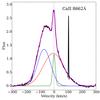
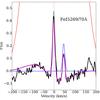
Fig. 4
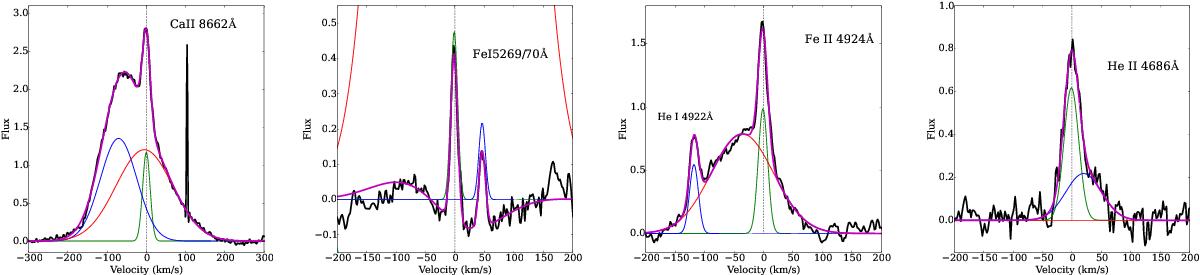
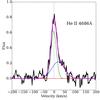
Some of the multi-Gaussian fits for one of the dates (JD 2 455 674.82443). The normalised, continuum-subtracted observed spectra are displayed as thick black lines. Individual Gaussian components are plotted as thin lines (colours: green, red, blue, cyan). The combined fit is plotted as a magenta thick line. The zero velocities of the central line are also marked with a vertical dotted line. The plots are labelled with the line(s) elements and wavelength. Note that the very complex shape of the continuum around the Fe I 5269/70 Å lines is better fitted by two strong Gaussians, one in emission and the other in absorption (partly out of the figure). These BC have no physical meaning/interpretation, but allow us to extract properly the strong NC of both lines.
Current usage metrics show cumulative count of Article Views (full-text article views including HTML views, PDF and ePub downloads, according to the available data) and Abstracts Views on Vision4Press platform.
Data correspond to usage on the plateform after 2015. The current usage metrics is available 48-96 hours after online publication and is updated daily on week days.
Initial download of the metrics may take a while.