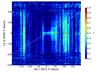
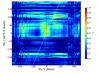
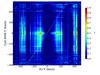
Fig. 3
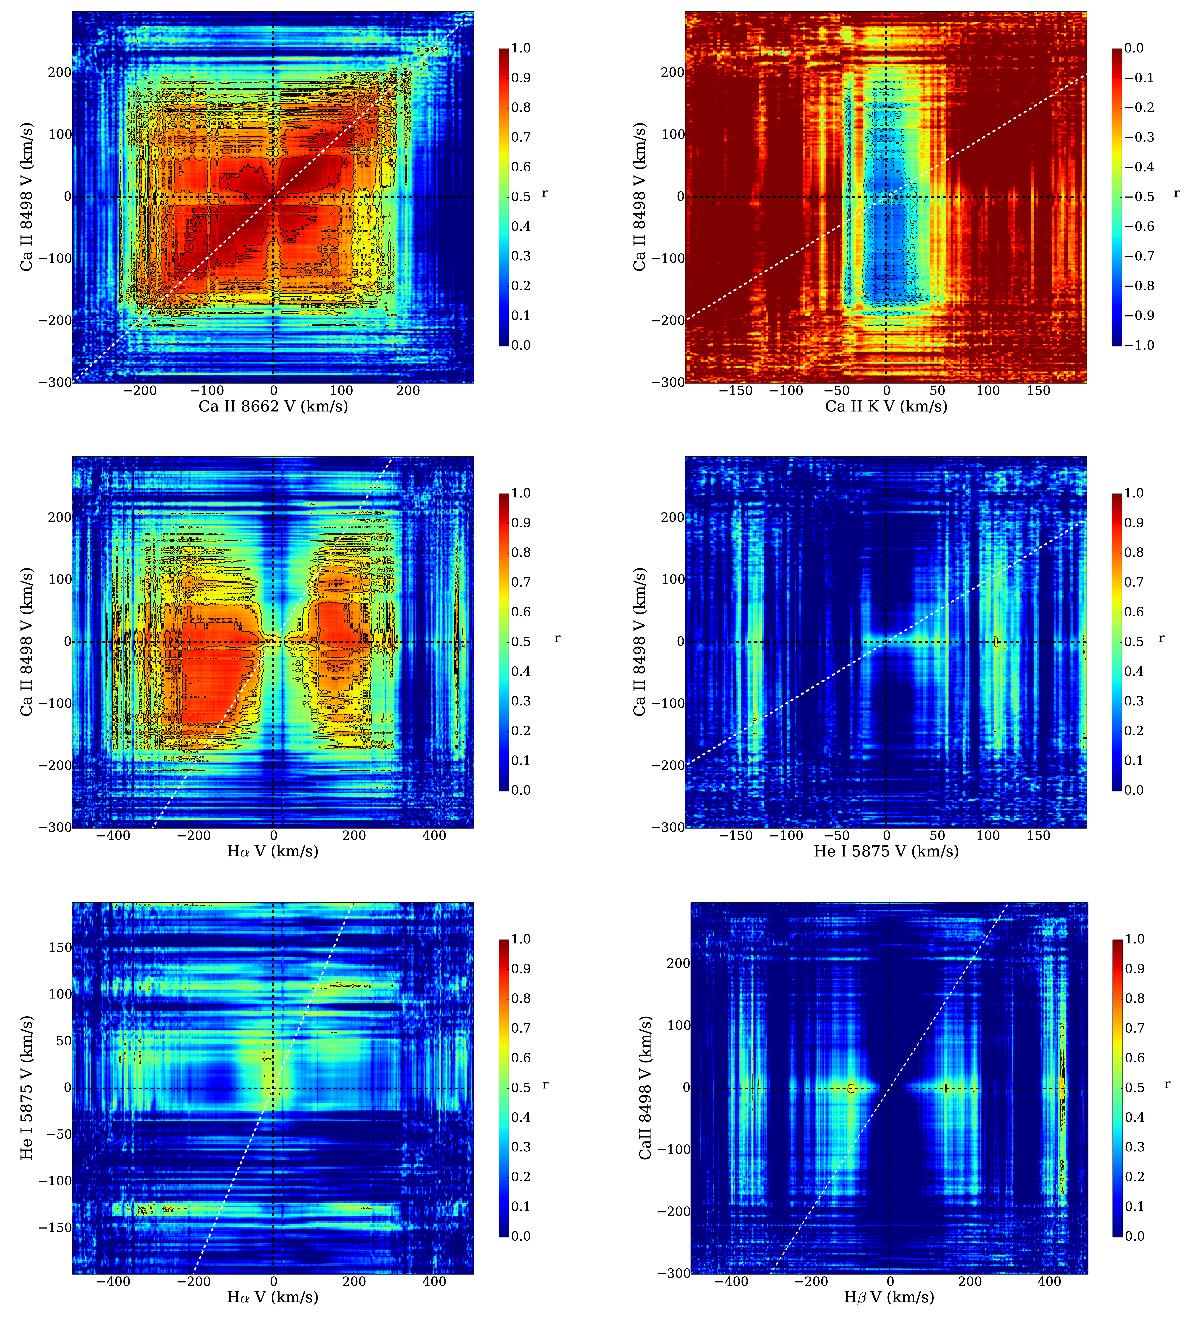
Pixel-by-pixel velocity cross-correlations between different lines. From top to bottom, left to right: Ca II 8498 vs. 8662 Å, Ca II K vs. Ca II 8498 Å, Ca II 8498 Å vs. Hα, Ca II 8222 Å vs. He I 5875 Å, Hα vs. He I 5875 Å, and Ca II 8498 Å vs. Hβ. The correlation coefficient (estimated as a Spearman rank correlation with value r and false alarm probability p) is shown on the right in the colour scheme, with the contours marking the high significance (p> 10-5) areas with r = 0.6,0.7,0.8,0.9.
Current usage metrics show cumulative count of Article Views (full-text article views including HTML views, PDF and ePub downloads, according to the available data) and Abstracts Views on Vision4Press platform.
Data correspond to usage on the plateform after 2015. The current usage metrics is available 48-96 hours after online publication and is updated daily on week days.
Initial download of the metrics may take a while.