Fig. 2
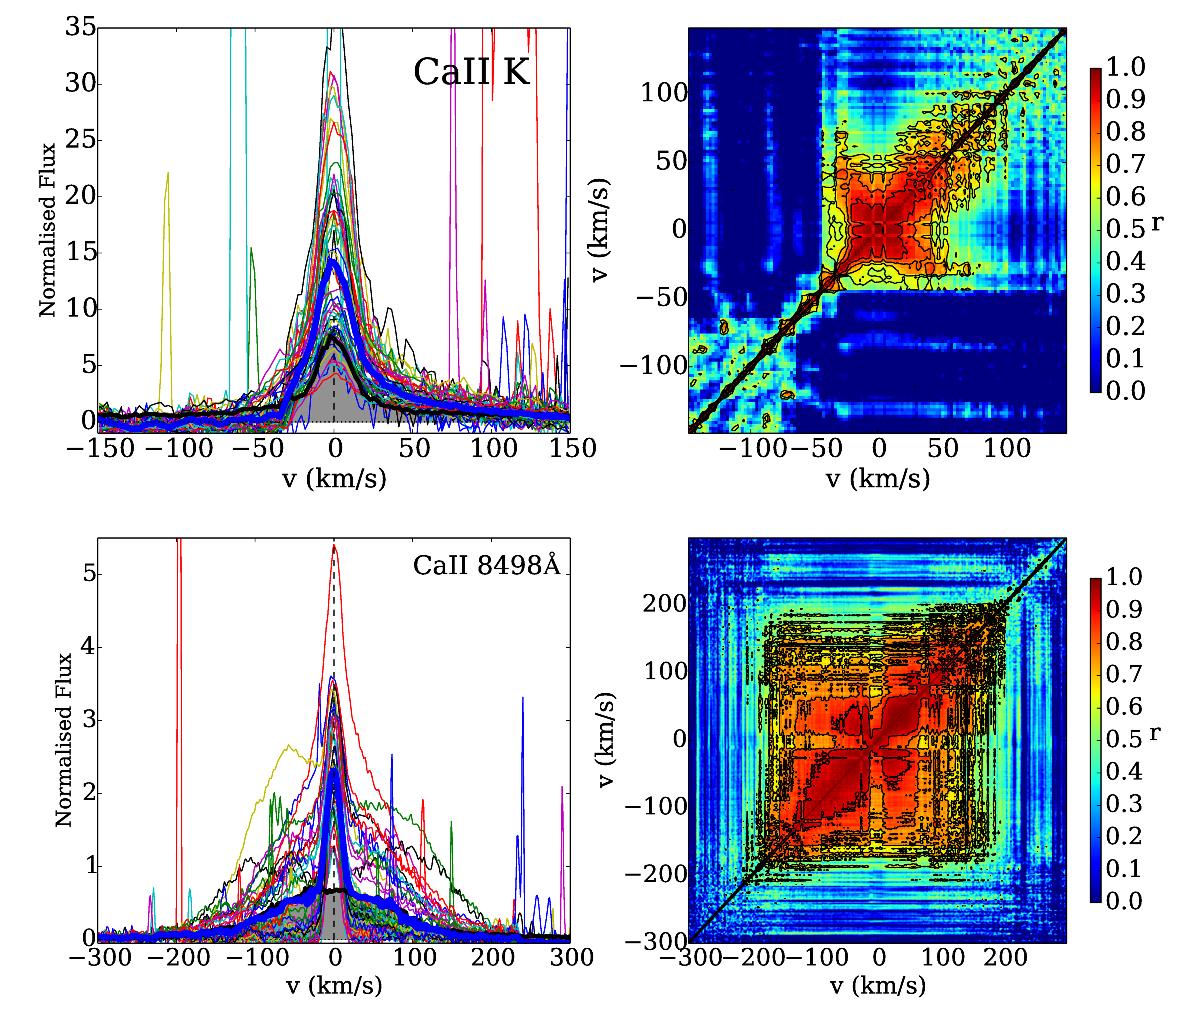
Same as Fig. 1 for the Ca II K (top) and 8498 Å (bottom) lines. The pixel-by-pixel median of the line is shown as a thick blue line. The pixel-by-pixel rms is shown as the thick black line and shaded area. The zero velocities/wavelengths of the lines are marked as dashed vertical lines. The correlation coefficient (estimated as a Spearman rank correlation with value r and false alarm probability p) is shown on the right in the colour scheme, with the black contours marking the high significance (p> 10-5) areas with r = 0.6,0.7,0.8,0.9.
Current usage metrics show cumulative count of Article Views (full-text article views including HTML views, PDF and ePub downloads, according to the available data) and Abstracts Views on Vision4Press platform.
Data correspond to usage on the plateform after 2015. The current usage metrics is available 48-96 hours after online publication and is updated daily on week days.
Initial download of the metrics may take a while.