Fig. 8
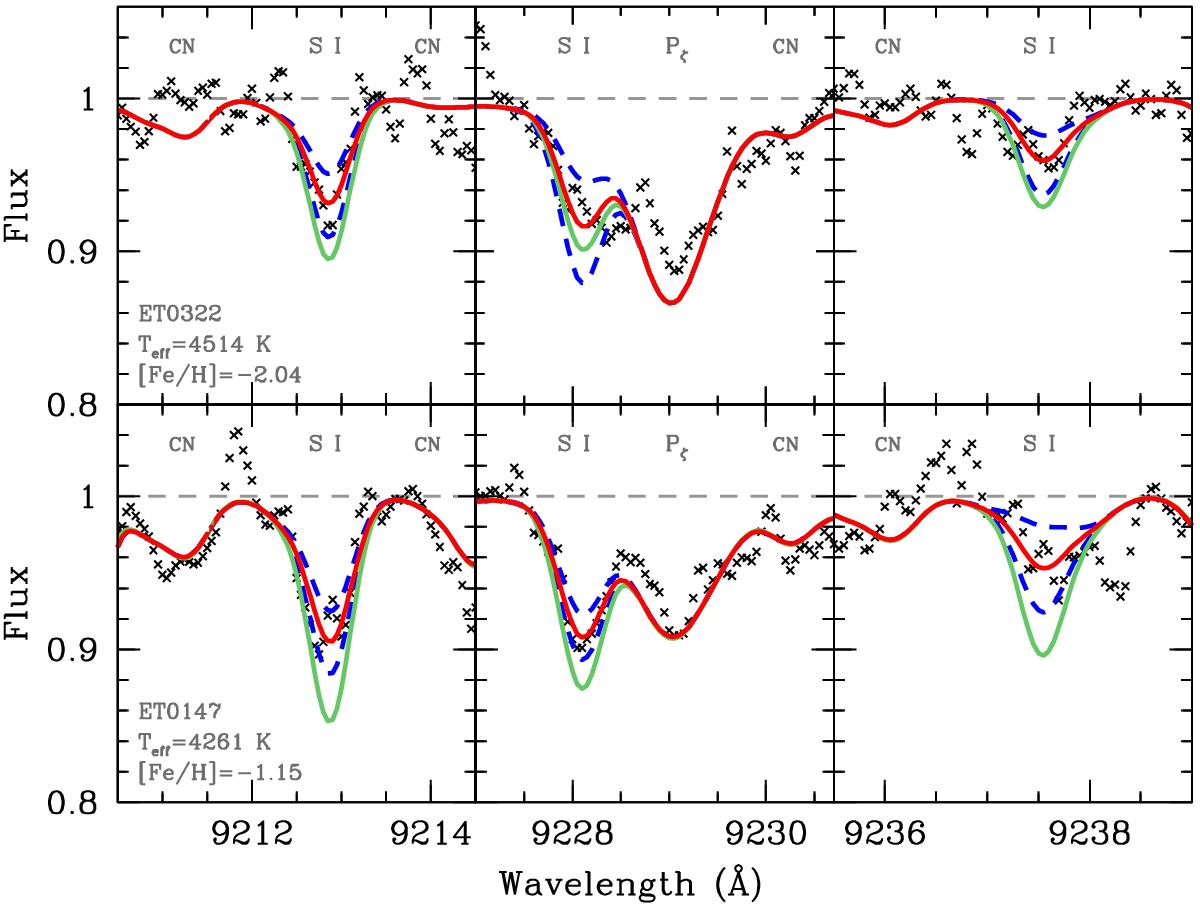
Spectra for the S-low stars, ET0322 and ET0147, are shown with black crosses. Red solid lines are the best fits of each S line, and blue dashed lines are the measurement errors, δnoise, as listed in Table A.2. Green solid lines show [S/Fe] = 0.40 in the upper panel, and [S/Fe] = 0.15 in the lower panel, which are the average (LTE) S abundances in the sample, in the range ± 0.25 from the [Fe/H] of each star.
Current usage metrics show cumulative count of Article Views (full-text article views including HTML views, PDF and ePub downloads, according to the available data) and Abstracts Views on Vision4Press platform.
Data correspond to usage on the plateform after 2015. The current usage metrics is available 48-96 hours after online publication and is updated daily on week days.
Initial download of the metrics may take a while.