Fig. 5
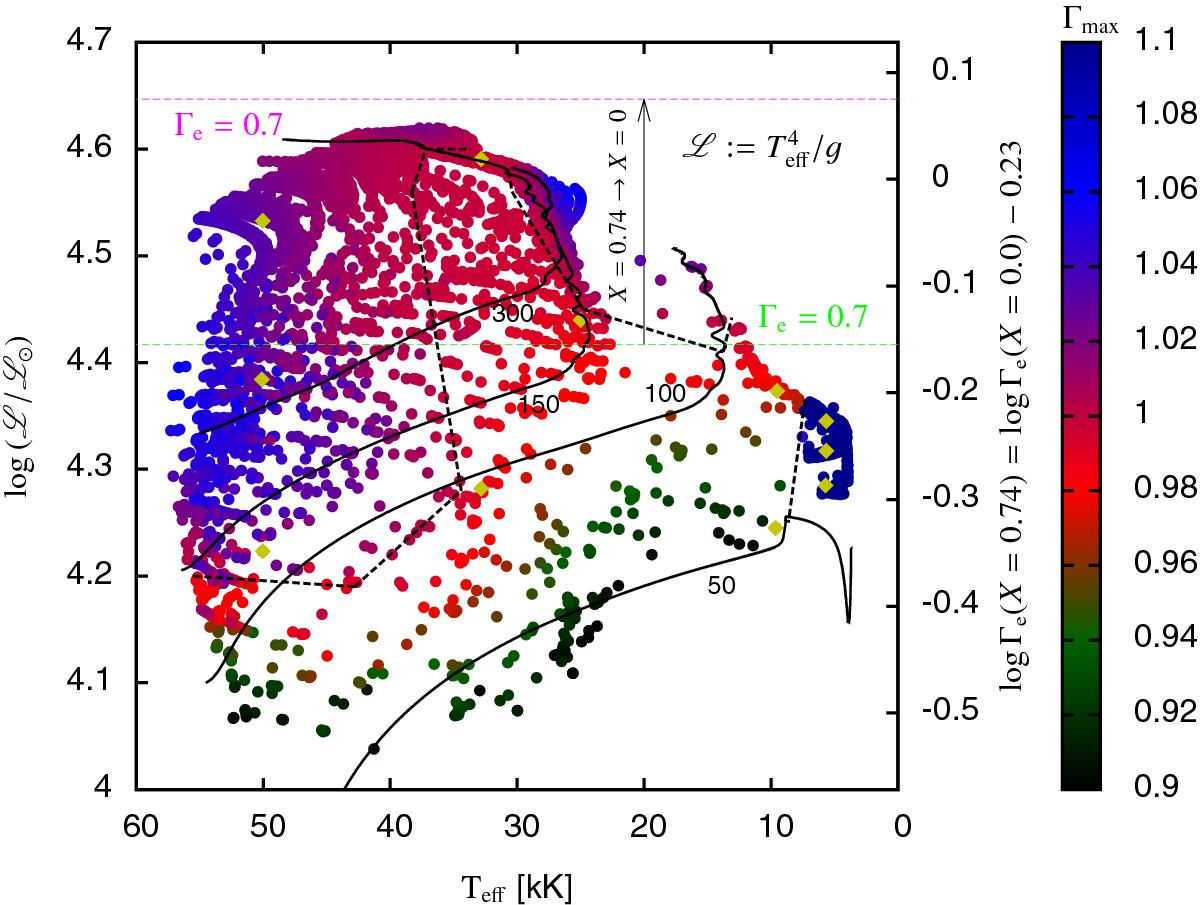
Analysed models shown as coloured dots on the spectroscopic HR diagram (sHRD) with the colour representing the value of Γmax in each model. The Eddington factor Γe (assuming electron scattering opacity only) is directly proportional to the quantity L and is indicated on the right Y-axis for a hydrogen mass fraction of X = 0.74. Some representative evolutionary tracks of non-rotating models, for different initial masses (indicated along the tracks in units of solar mass), are also shown with solid black lines. The green and blue dotted horizontal lines correspond to Γe = 0.7 for X = 0.7 and X = 0, respectively. The colour palette and the models marked with yellow diamonds correspond to those in Fig. 2. The black dashed line roughly divides the sHRD into distinct regions with Γmax> 1 and Γmax< 1.
Current usage metrics show cumulative count of Article Views (full-text article views including HTML views, PDF and ePub downloads, according to the available data) and Abstracts Views on Vision4Press platform.
Data correspond to usage on the plateform after 2015. The current usage metrics is available 48-96 hours after online publication and is updated daily on week days.
Initial download of the metrics may take a while.