Fig. 3
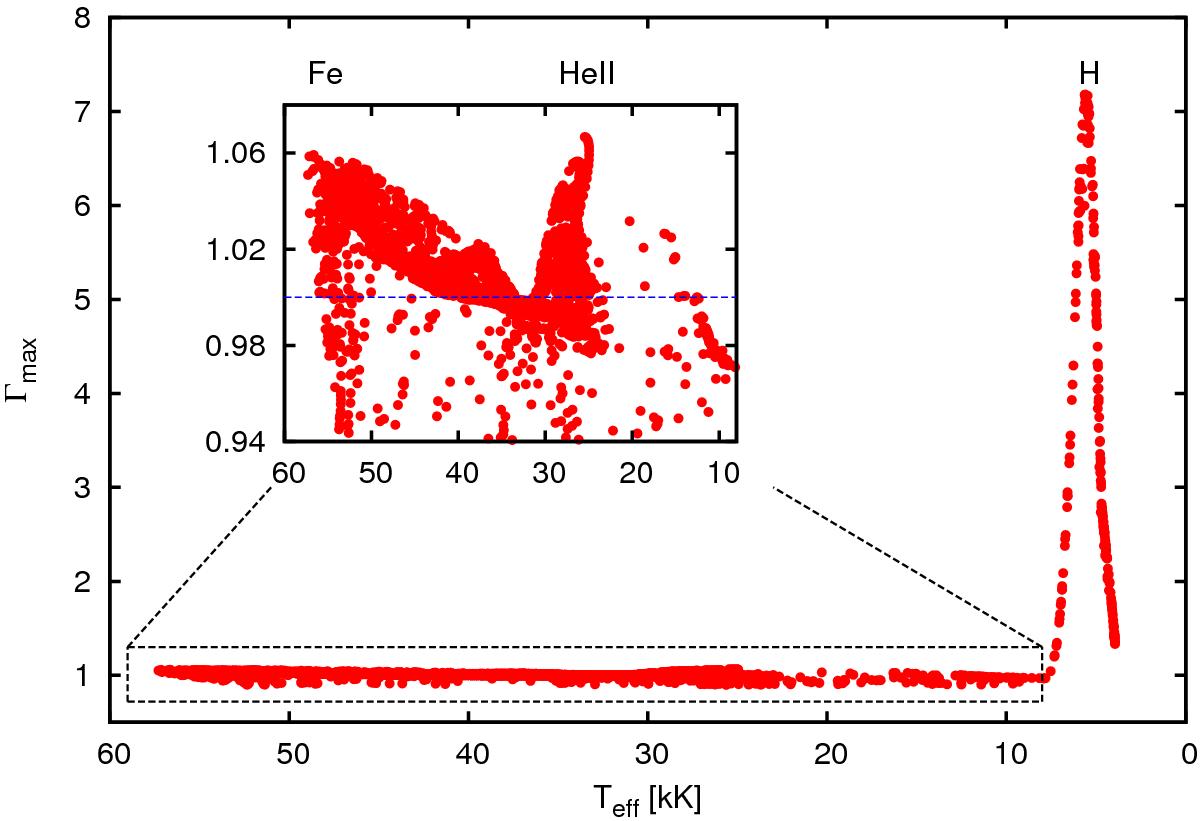
Maximum Eddington factor in the analysed stellar models as a function of Teff for all stellar models shown in Fig. 2, i.e. with Γmax> 0.9. The three peaks in Γmax at Teff/ kK of ~55, 25, and 5.5 correspond to the three opacity bumps associated with the ionisation zones of Fe, HeII and H respectively. Inset: models with Γmax> 0.94 and Teff/ kK ≳ 10 kK. The blue horizontal line at Γmax = 1 is drawn for reference.
Current usage metrics show cumulative count of Article Views (full-text article views including HTML views, PDF and ePub downloads, according to the available data) and Abstracts Views on Vision4Press platform.
Data correspond to usage on the plateform after 2015. The current usage metrics is available 48-96 hours after online publication and is updated daily on week days.
Initial download of the metrics may take a while.