Fig. 23
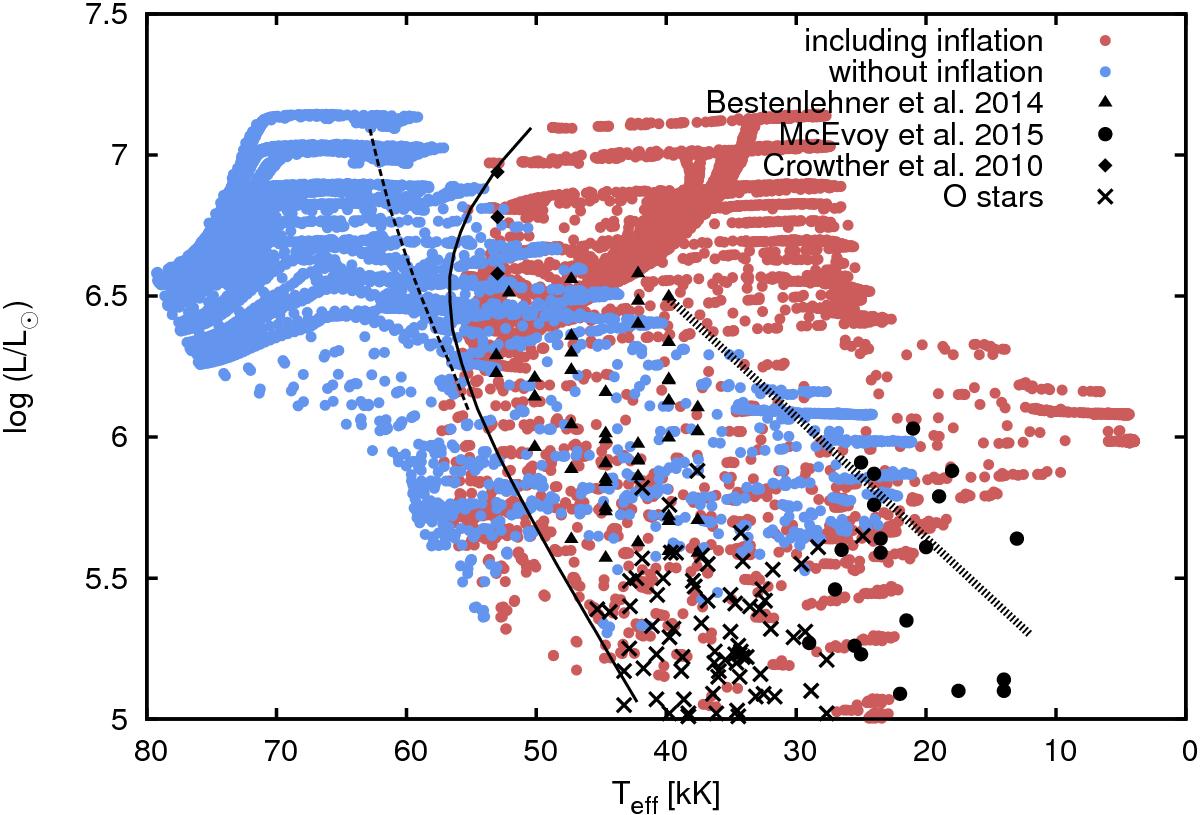
HR diagram showing the Köehler et al. models, which include inflation (red) and corresponding non-inflated stellar models (blue) above log L/L⊙> 5 (see text for explanation). The triangles refer to all the Of/WN and WNh single stars studied by Bestenlehner et al. (2014) whereas the black dots and diamonds refer to the B-supergiants (single) from McEvoy et al. (2015) and WN5h stars of the core R136 from Crowther et al. (2010), respectively. The O stars observed within the VFTS survey are marked with crosses (Sabín-Sanjulián et al. 2014; Ramirez-Agudelo et al., in prep.) The ZAMS of the non-rotating stars is marked with the solid line, while the dashed line indicates the approximate position of the ZAMS if inflation was absent (see text for further details). The hot part of the S Doradus instability strip from Smith et al. (2004) is also shown for reference.
Current usage metrics show cumulative count of Article Views (full-text article views including HTML views, PDF and ePub downloads, according to the available data) and Abstracts Views on Vision4Press platform.
Data correspond to usage on the plateform after 2015. The current usage metrics is available 48-96 hours after online publication and is updated daily on week days.
Initial download of the metrics may take a while.