Fig. 2
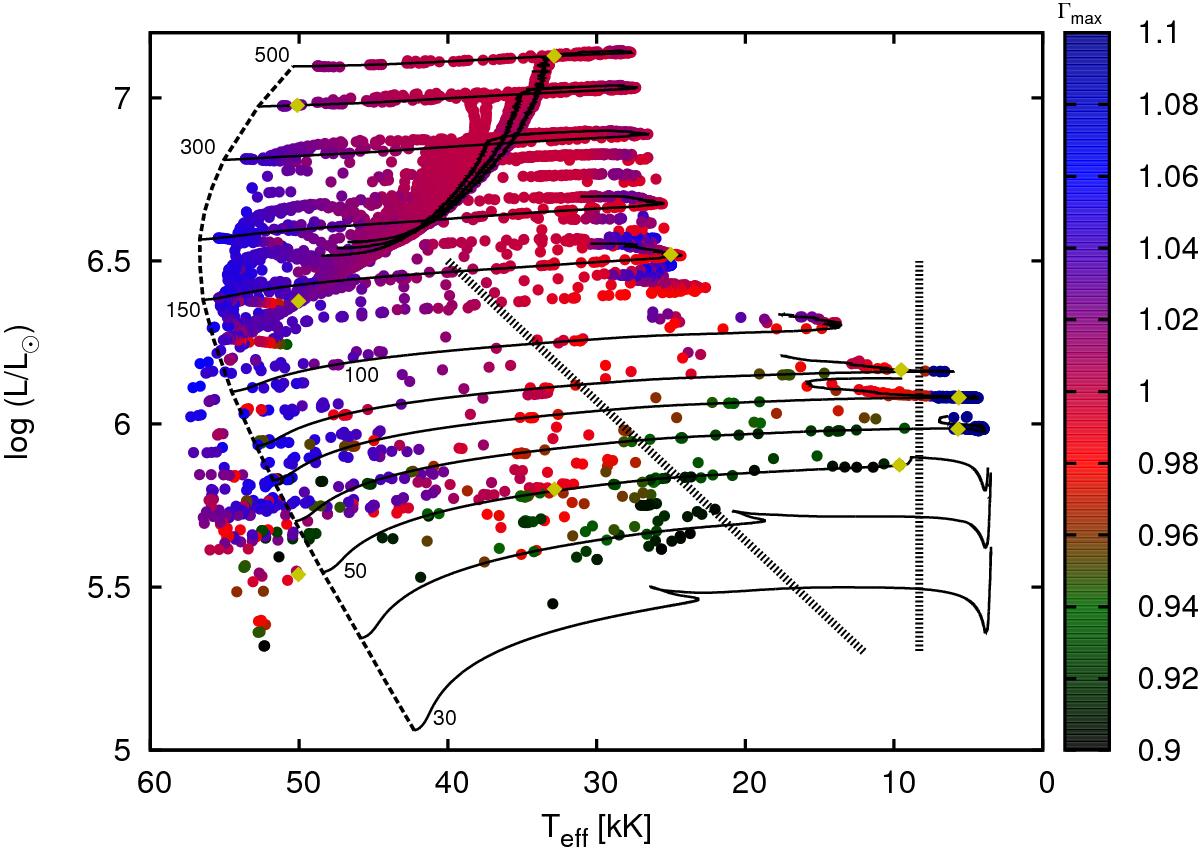
Positions of the analysed stellar models with Γmax> 0.9 in the Hertzsprung-Russell (HR) diagram (coloured dots). Models with Γmax> 1.1 are coloured dark blue. The solid lines show the evolutionary tracks of non-rotating stellar models (Köhler et al. 2015). The initial masses are marked in units of solar mass. The dashed line corresponds to the zero-age main-sequence of the non-rotating models. The hot and the cool edges of the S Dor instability strip from (Smith et al. 2004) are indicated with thick dotted lines. The interior structures of the models marked with yellow diamonds are shown in Appendix D.
Current usage metrics show cumulative count of Article Views (full-text article views including HTML views, PDF and ePub downloads, according to the available data) and Abstracts Views on Vision4Press platform.
Data correspond to usage on the plateform after 2015. The current usage metrics is available 48-96 hours after online publication and is updated daily on week days.
Initial download of the metrics may take a while.