Fig. 19
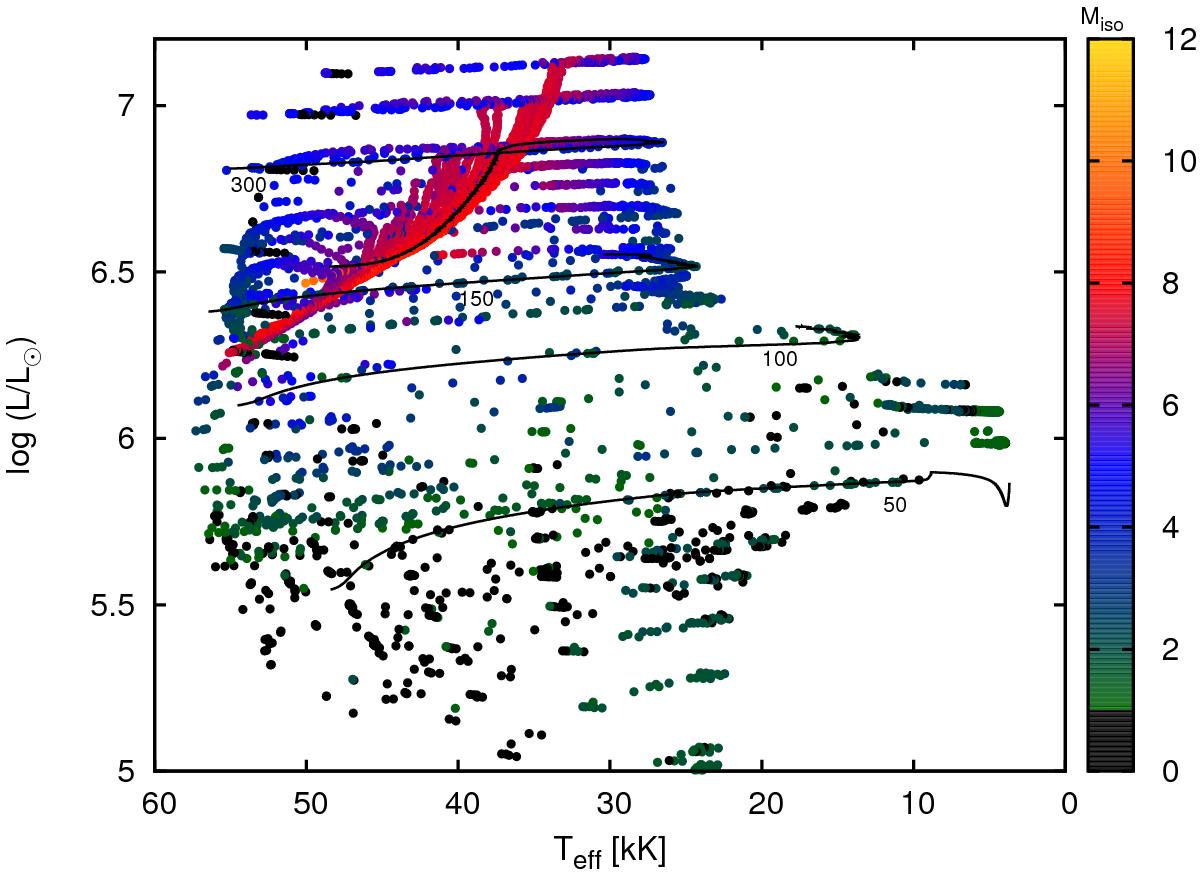
Upper HR diagram (log L/L⊙> 5) showing the maximum of the ratio of the convective velocity to the local isothermal sound speed (Miso) of the analysed models as coloured dots. Models with Miso< 1 are shown in black. Some representative evolutionary tracks of non-rotating models, for different initial masses (indicated along the tracks in units of solar mass), are also shown with solid black lines.
Current usage metrics show cumulative count of Article Views (full-text article views including HTML views, PDF and ePub downloads, according to the available data) and Abstracts Views on Vision4Press platform.
Data correspond to usage on the plateform after 2015. The current usage metrics is available 48-96 hours after online publication and is updated daily on week days.
Initial download of the metrics may take a while.