Fig. 14
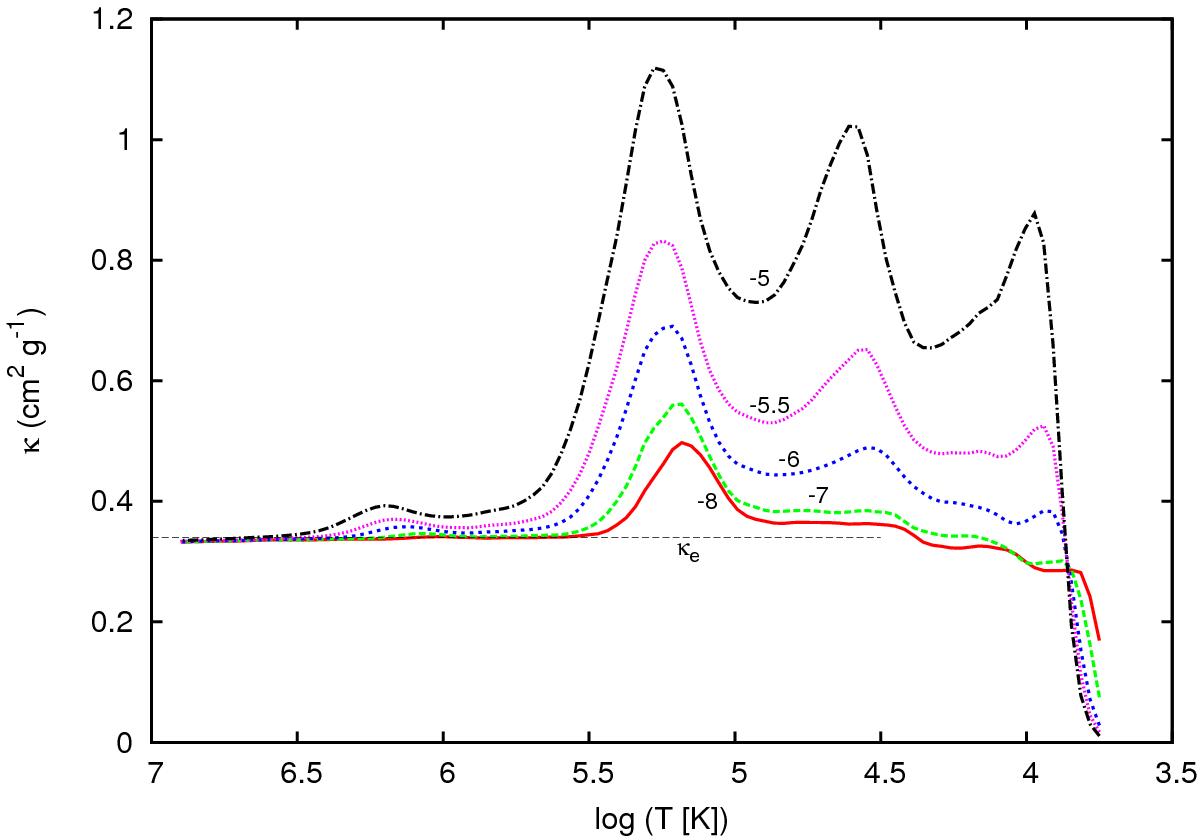
Opacity as a function of temperature for fixed values of the opacity parameter R defined as ![]() , where T6 is the temperature in units of 106 Kelvin. The values of log R, which are held constant, are indicated along the curves. The data is taken from the OPAL tables with a composition of X = 0.7000, Y = 0.2960, Z = 0.004 (Iglesias & Rogers 1996). The black horizontal line shows the electron scattering opacity κe for a hydrogen mass fraction of X = 0.7. At a temperature of 200 000 K, log R = −5 implies a density of ρ = 8 × 10⁻⁸ g cm-3 and log R = −8 implies a density of ρ = 8 × 10-11 g cm-3.
, where T6 is the temperature in units of 106 Kelvin. The values of log R, which are held constant, are indicated along the curves. The data is taken from the OPAL tables with a composition of X = 0.7000, Y = 0.2960, Z = 0.004 (Iglesias & Rogers 1996). The black horizontal line shows the electron scattering opacity κe for a hydrogen mass fraction of X = 0.7. At a temperature of 200 000 K, log R = −5 implies a density of ρ = 8 × 10⁻⁸ g cm-3 and log R = −8 implies a density of ρ = 8 × 10-11 g cm-3.
Current usage metrics show cumulative count of Article Views (full-text article views including HTML views, PDF and ePub downloads, according to the available data) and Abstracts Views on Vision4Press platform.
Data correspond to usage on the plateform after 2015. The current usage metrics is available 48-96 hours after online publication and is updated daily on week days.
Initial download of the metrics may take a while.