Free Access
Fig. 13
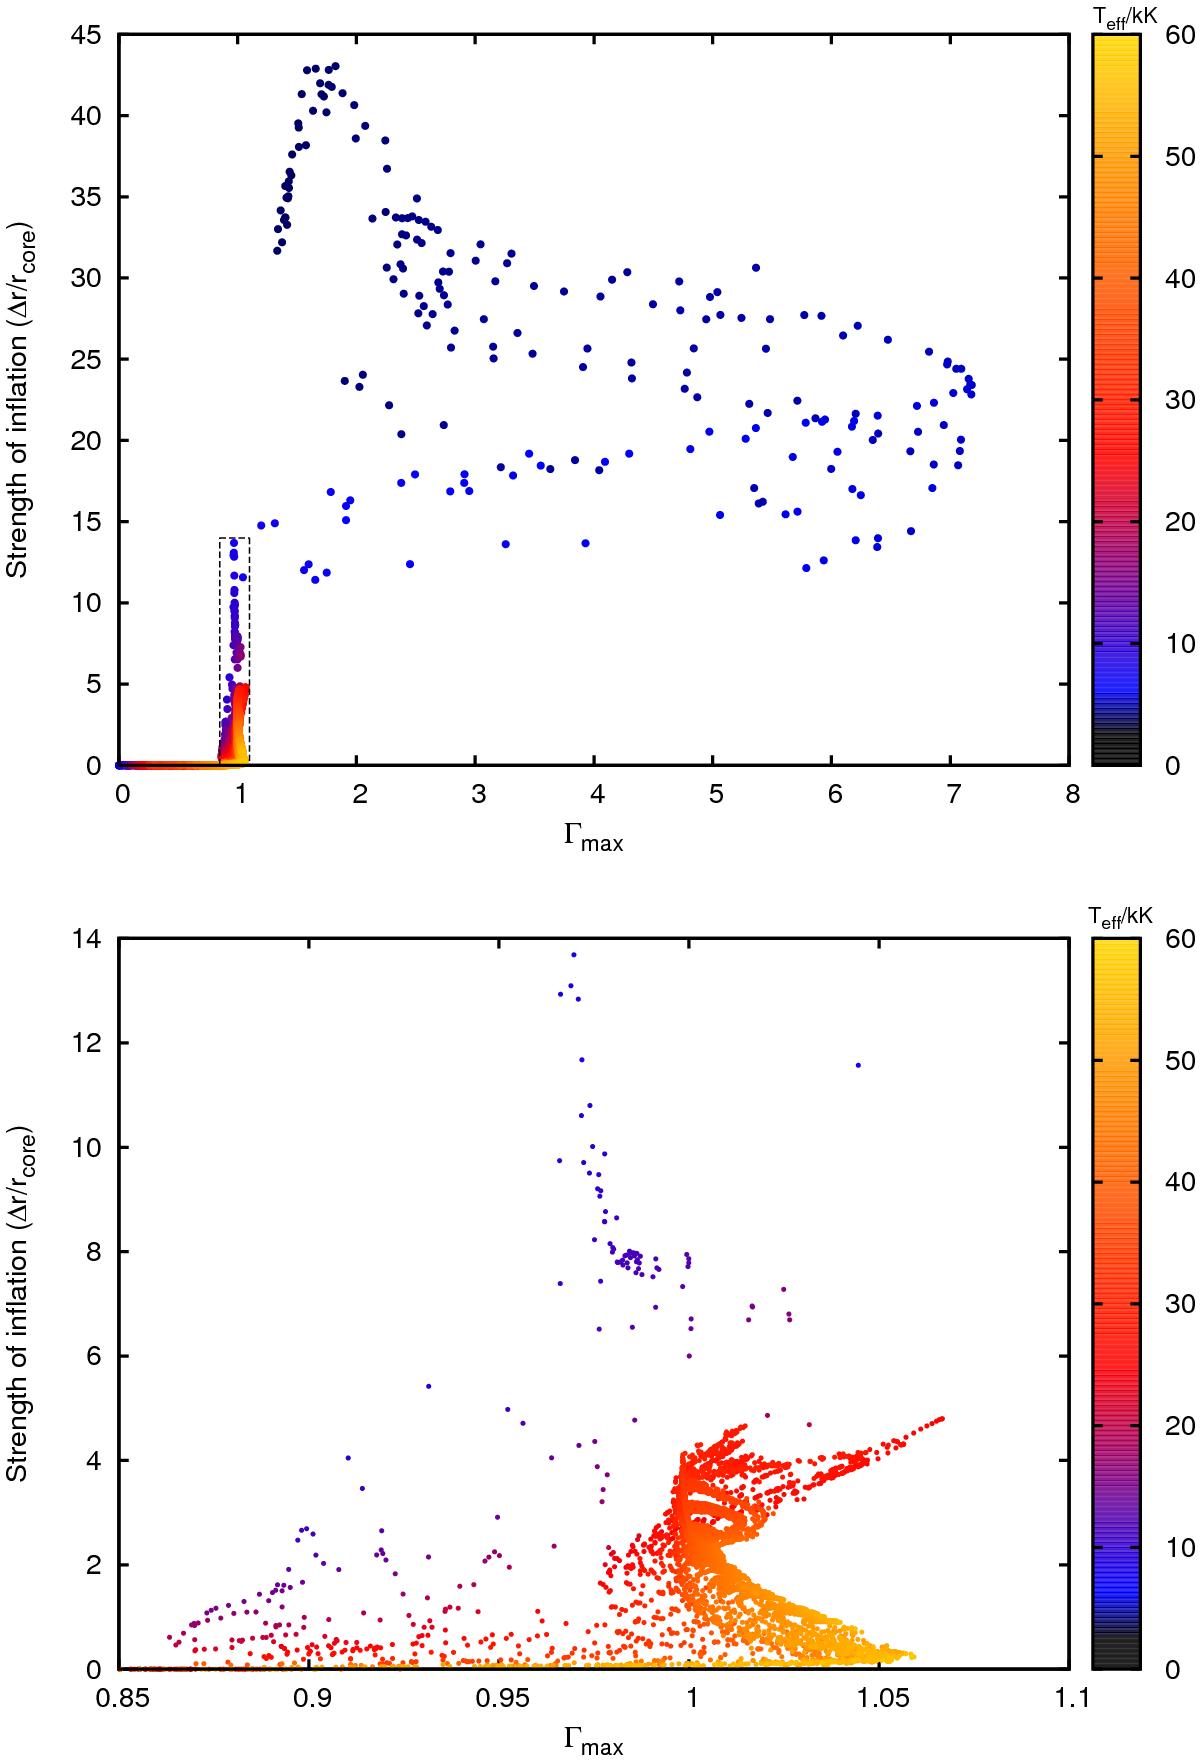
Top: inflation (Δr/rcore) as a function of Γmax for the analysed models. The effective temperature of every model is colour-coded. The area within the black dotted lines is magnified below. Bottom: zoomed-in view of the dotted region in the top panel around Γmax = 1.
Current usage metrics show cumulative count of Article Views (full-text article views including HTML views, PDF and ePub downloads, according to the available data) and Abstracts Views on Vision4Press platform.
Data correspond to usage on the plateform after 2015. The current usage metrics is available 48-96 hours after online publication and is updated daily on week days.
Initial download of the metrics may take a while.