Fig. 10
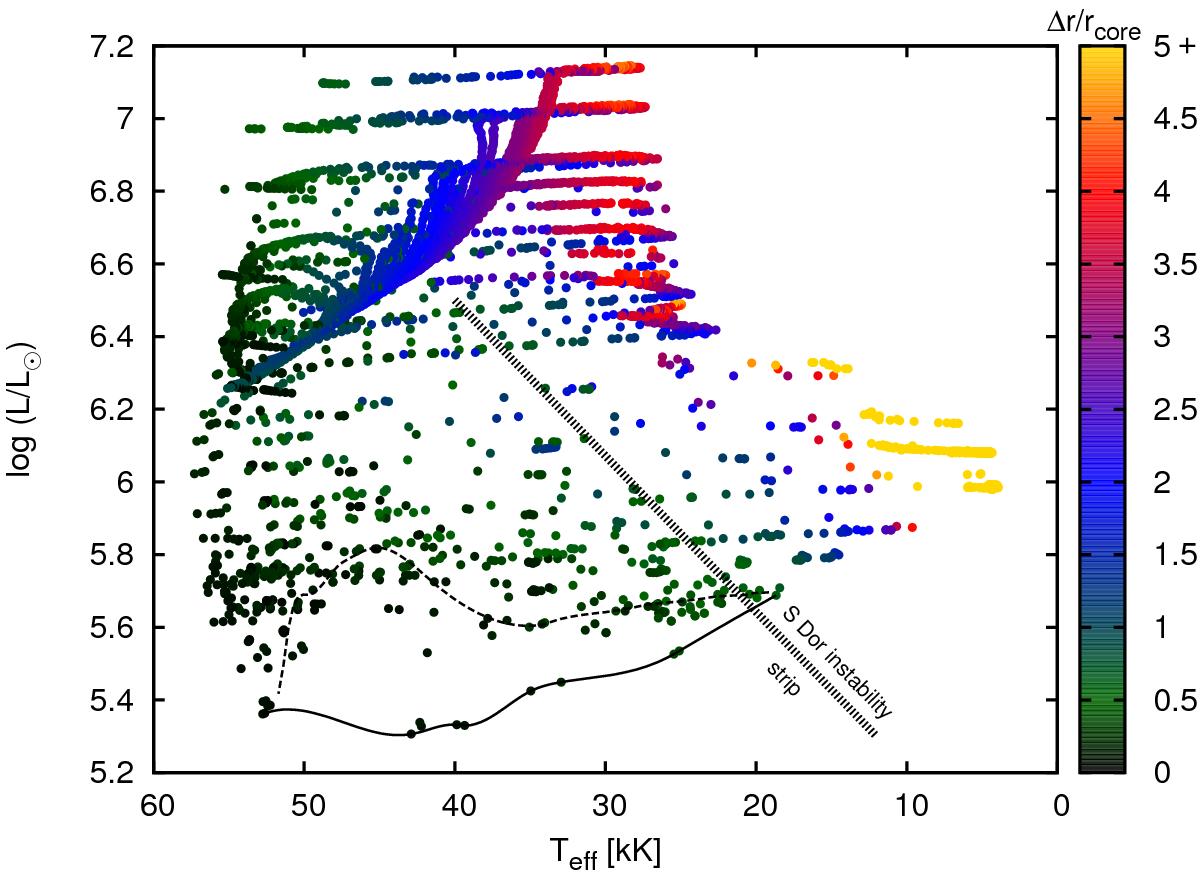
Hertzprung-Russell diagram showing all the core-hydrogen burning inflated models, i.e with Δr/rcore> 0. Models with Δr/rcore> 5 are coloured yellow. Below the solid black line we do not find any inflated models and above the dotted black line we do not find any non-inflated models in our grid. The hot part of the S Dor instability strip is also marked (Smith et al. 2004).
Current usage metrics show cumulative count of Article Views (full-text article views including HTML views, PDF and ePub downloads, according to the available data) and Abstracts Views on Vision4Press platform.
Data correspond to usage on the plateform after 2015. The current usage metrics is available 48-96 hours after online publication and is updated daily on week days.
Initial download of the metrics may take a while.