Fig. 7
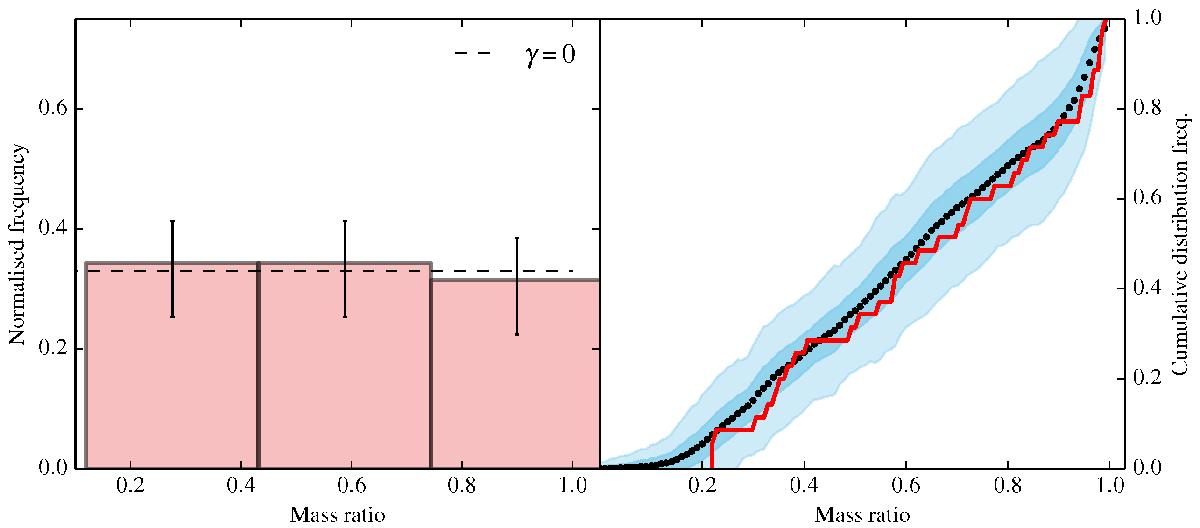
Left panel: normalised frequency of mass-ratios. The dashed line represents a power-law function with index γ = 0. Right panel: the cumulative frequency distribution of mass-ratios using the two methods outlined in Sect. 5.2. Method (i) The red line represent the derived mass ratios. Method (ii) The black dots, dark and light blue-coloured area represent the average, 1σ and 3σ variation in frequency from 100 realisations of the mass ratio, respectively.
Current usage metrics show cumulative count of Article Views (full-text article views including HTML views, PDF and ePub downloads, according to the available data) and Abstracts Views on Vision4Press platform.
Data correspond to usage on the plateform after 2015. The current usage metrics is available 48-96 hours after online publication and is updated daily on week days.
Initial download of the metrics may take a while.