Fig. 5
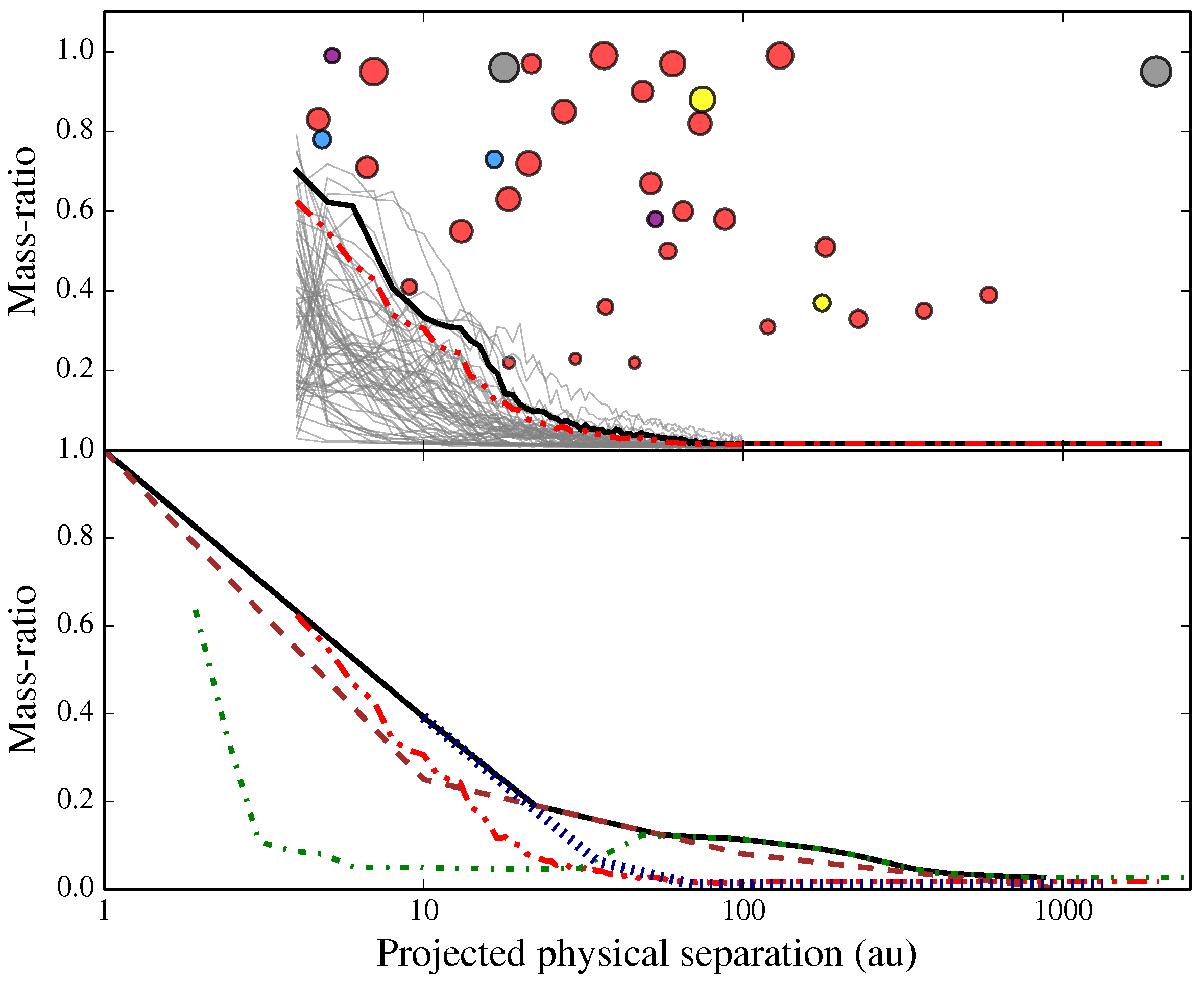
Top panel: physical projected separations versus mass-ratio for identified multiple systems. The filled red markers represent binary companions, the other coloured markers are components of triple systems with matching colours for the secondary and tertiary. The size of the marker is proportional the companion’s mass. The grey lines represent the sensitivity limits for the individual targets. The red and black lines represent the 90% and 95% detections limits for the whole sample, respectively. Bottom panel: 95% detection limits for four studies, red: this work, blue: Daemgen et al. (2015), green: Kraus et al. (2011) and brown: Raghavan et al. (2010), used for analysis in Sect. 6.
Current usage metrics show cumulative count of Article Views (full-text article views including HTML views, PDF and ePub downloads, according to the available data) and Abstracts Views on Vision4Press platform.
Data correspond to usage on the plateform after 2015. The current usage metrics is available 48-96 hours after online publication and is updated daily on week days.
Initial download of the metrics may take a while.