Fig. 1
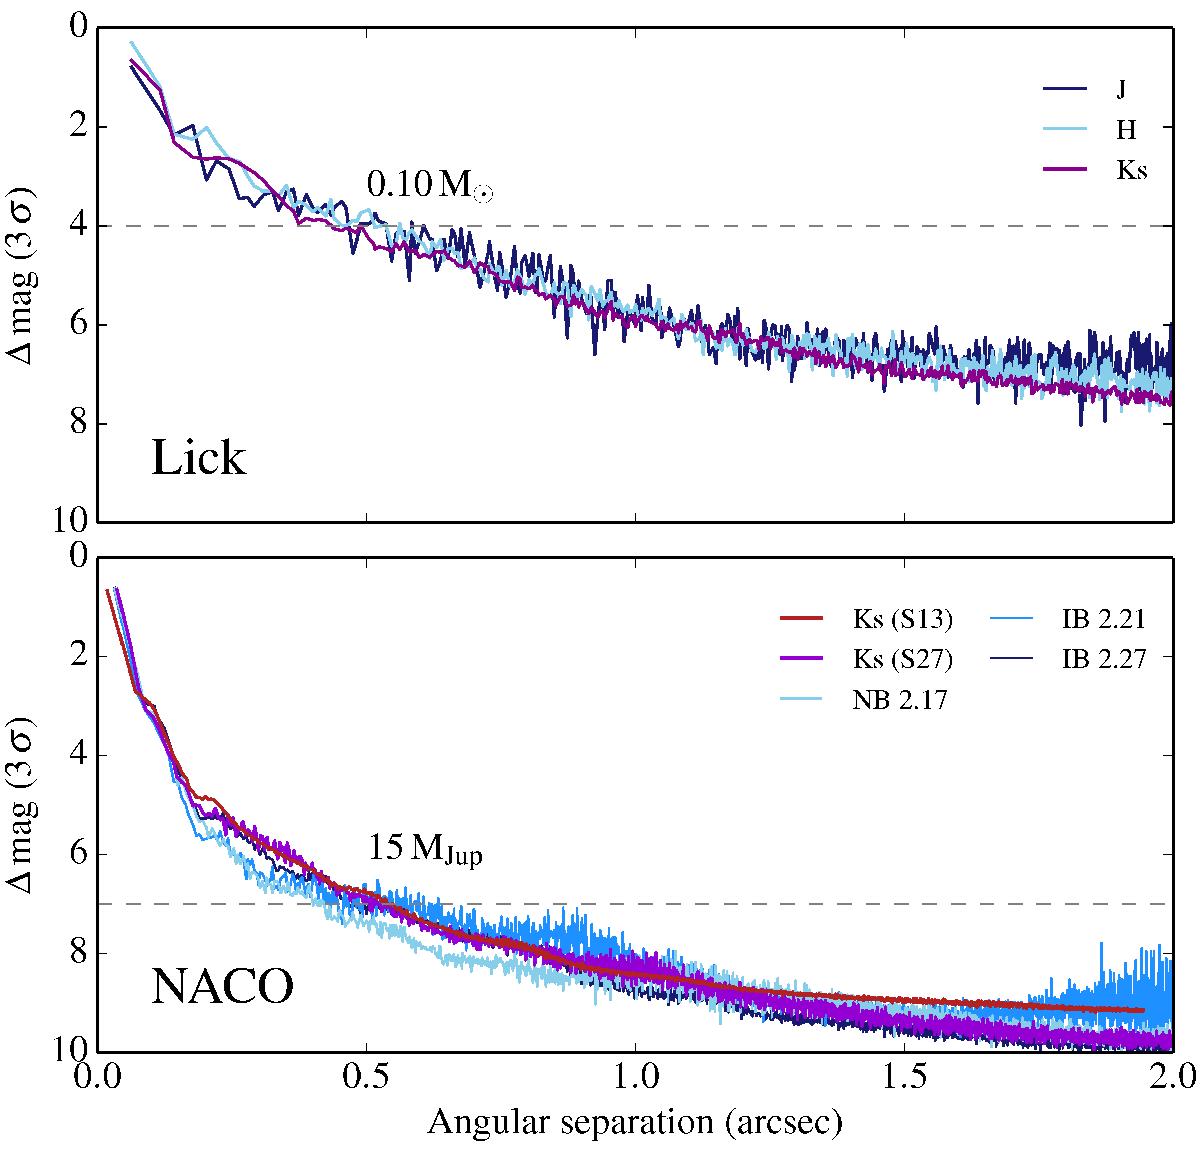
Average sensitivity limit in all filters for both NACO and Lick data. The limits were computed from the 3σ root-mean squared (rms) of the PSF radial profile for each target, and then averaged within each filter. The Ks filter for the NACO data is given for the S13 and S27 objective. The dashed lines represent our mass limits at 0.̋5, according to Baraffe et al. (1998) evolutionary tracks, assuming an average age of 30 Myr and a primary mass of 1 M⊙.
Current usage metrics show cumulative count of Article Views (full-text article views including HTML views, PDF and ePub downloads, according to the available data) and Abstracts Views on Vision4Press platform.
Data correspond to usage on the plateform after 2015. The current usage metrics is available 48-96 hours after online publication and is updated daily on week days.
Initial download of the metrics may take a while.