Fig. 2
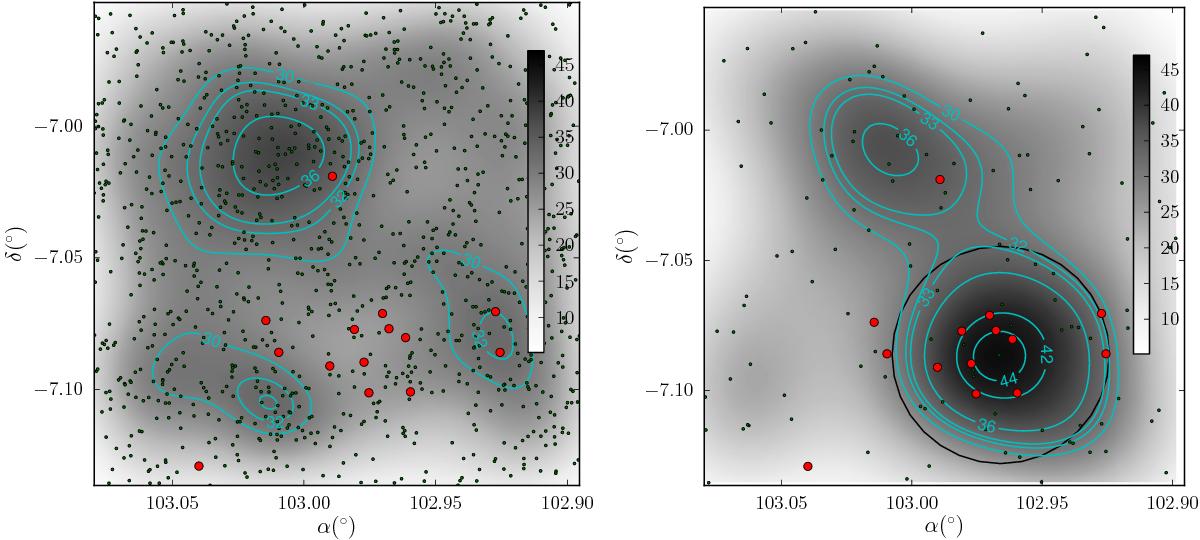
Left panel: density map constructed using all stars brighter that V = 18. Right panel: density map constructed using only stars within 0.1 mag of the cluster’s photometric sequence, and brighter than 18 mag. The black circle denotes the derived cluster limit. It is centered at α2000 = 06:51:51.820, δ2000 = −07:05:10.68 (α2000 = 102.965916°, δ2000 = −7.086300°) and has a radius of 2.5′. In both panels, the brighter and bluer stars (V< 13 and B−V< 0.6), most of which are cluster members, are indicated in red. The density grayscale is in arbitrary units. See text for details.
Current usage metrics show cumulative count of Article Views (full-text article views including HTML views, PDF and ePub downloads, according to the available data) and Abstracts Views on Vision4Press platform.
Data correspond to usage on the plateform after 2015. The current usage metrics is available 48-96 hours after online publication and is updated daily on week days.
Initial download of the metrics may take a while.