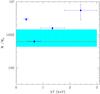
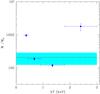
Fig. 5

Top panel: mass deposition rate Ṁ as a function of the temperature from the analysis of the MOS data of the Phoenix with a multi-component mkcflow model. Error bars are at 1σ confidence level and arrows represent upper limits at 1σ (the systematic uncertainty is not included here). The red horizontal line shows the best-fit value from the single mkcflow model in the 0.3−3.0 keV temperature range, while the shaded area shows the 1σ uncertainty. Bottom panel: same as in the top panel, but for the pn data.
Current usage metrics show cumulative count of Article Views (full-text article views including HTML views, PDF and ePub downloads, according to the available data) and Abstracts Views on Vision4Press platform.
Data correspond to usage on the plateform after 2015. The current usage metrics is available 48-96 hours after online publication and is updated daily on week days.
Initial download of the metrics may take a while.