Fig. 10
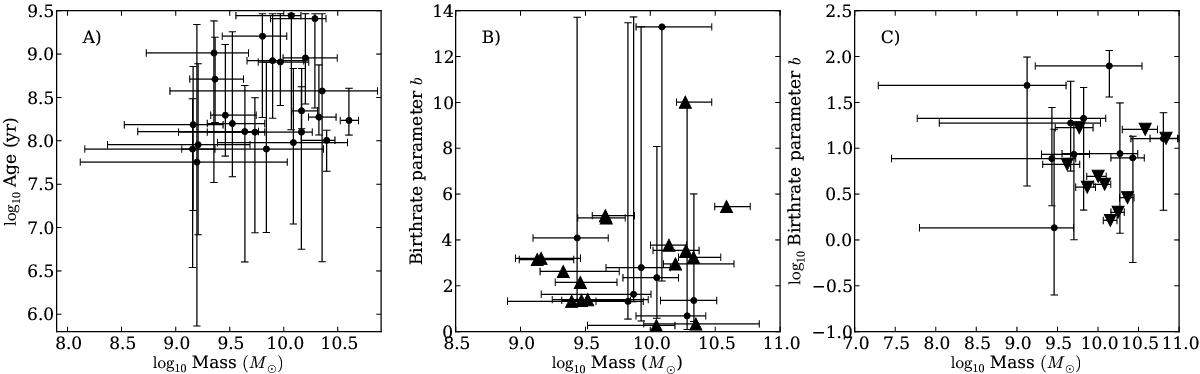
Left: age vs. mass for SED model A, using constant star formation rate. NB401_6-7 is not included in this graph as the age could not be constrained for this candidate. The mass in all three panels is the total mass that has gone into stars, i.e. the integral of the star formation rate over the age of the galaxy. Middle: birth parameter vs. Mass for SED model B, using an exponential star formation rate (Eq. (4)). Lower limits in the birth parameter correspond to lower limits in 1/τ and are denoted by upward pointing triangles. Right: birth parameter vs. Mass for SED model C. N.B. the logarithmic scale on the y-axis. Upper limits (1σ) are denoted with a downward pointing triangle. Four of the 25 candidates are not shown in this panel, for which the mass of the old population could not be recovered (see text). The mass is the total mass of the two populations combined.
Current usage metrics show cumulative count of Article Views (full-text article views including HTML views, PDF and ePub downloads, according to the available data) and Abstracts Views on Vision4Press platform.
Data correspond to usage on the plateform after 2015. The current usage metrics is available 48-96 hours after online publication and is updated daily on week days.
Initial download of the metrics may take a while.