Fig. 11
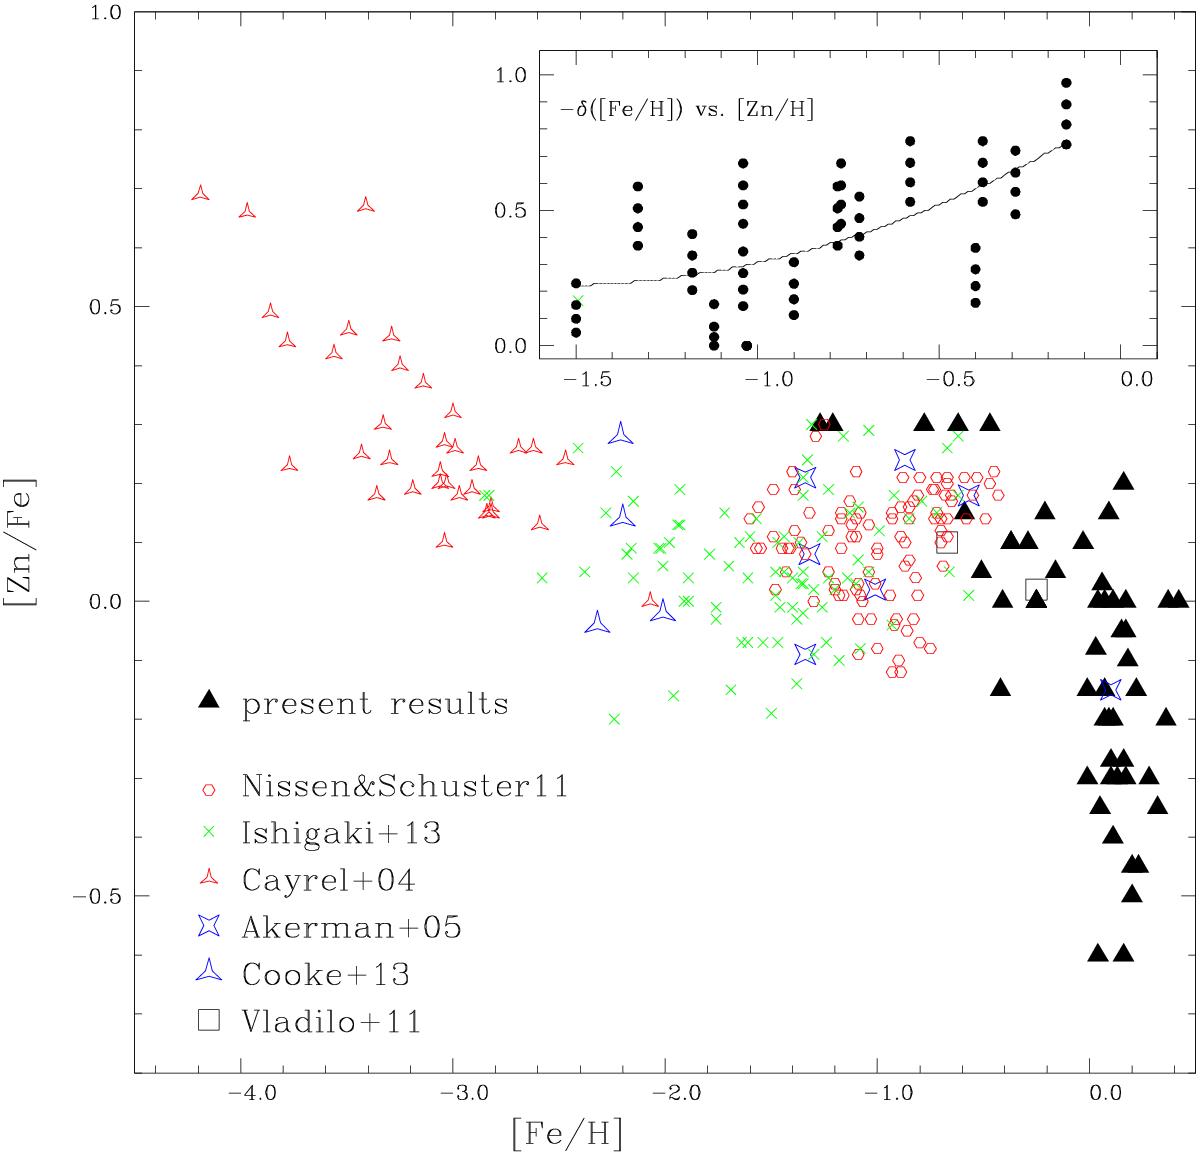
[Zn/Fe] vs. [Fe/H] for the present sample and for the DLA samples by Akerman et al. (2005) and Cooke et al. (2013). We also plot the halo stars from Cayrel et al. (2004) and thick disk and halo stars data from Nissen & Schuster (2011) and Ishigaki et al. (2013). The inserted plot shows the trend for the dust depletion correction for the abundance of iron with the observed [Zn/H] derived from applying four distinct dust models to 16 DLAs. The curve is the quadratic fit to the trend that is used for dust correction. The abundances from the model calculations are averaged values inside several shells, shown as curves labelled according to the inner and the outer radius of each shell.
Current usage metrics show cumulative count of Article Views (full-text article views including HTML views, PDF and ePub downloads, according to the available data) and Abstracts Views on Vision4Press platform.
Data correspond to usage on the plateform after 2015. The current usage metrics is available 48-96 hours after online publication and is updated daily on week days.
Initial download of the metrics may take a while.