Fig. 7
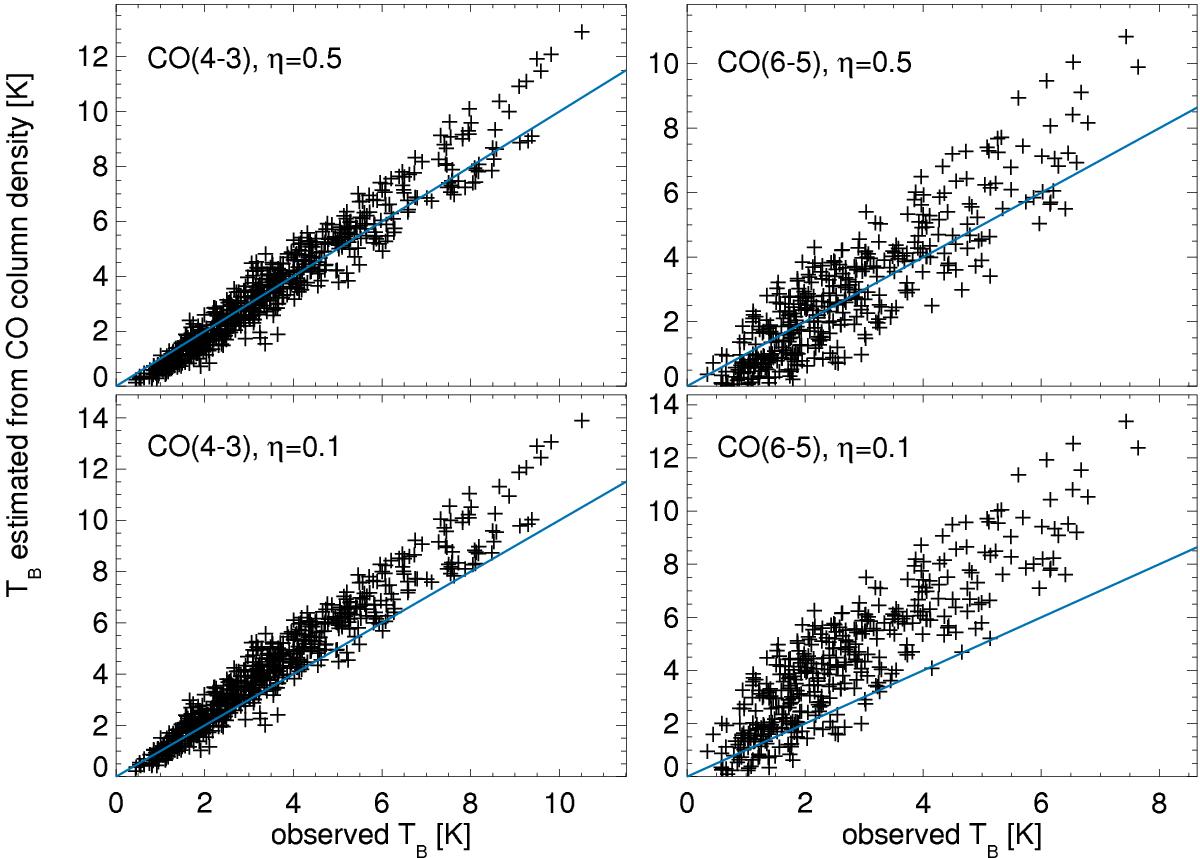
Peak brightness temperature of CO(4–3) (left panels) and CO(6–5) (right panels) estimated from the CO column density derived by using Tex under the assumption of η = 0.5 (upper panels) and 0.1 (lower panels) for all CO lines against observed TB (20′′ resolution). Blue lines indicate the case where the estimated and observed TB is the same.
Current usage metrics show cumulative count of Article Views (full-text article views including HTML views, PDF and ePub downloads, according to the available data) and Abstracts Views on Vision4Press platform.
Data correspond to usage on the plateform after 2015. The current usage metrics is available 48-96 hours after online publication and is updated daily on week days.
Initial download of the metrics may take a while.