Fig. 4
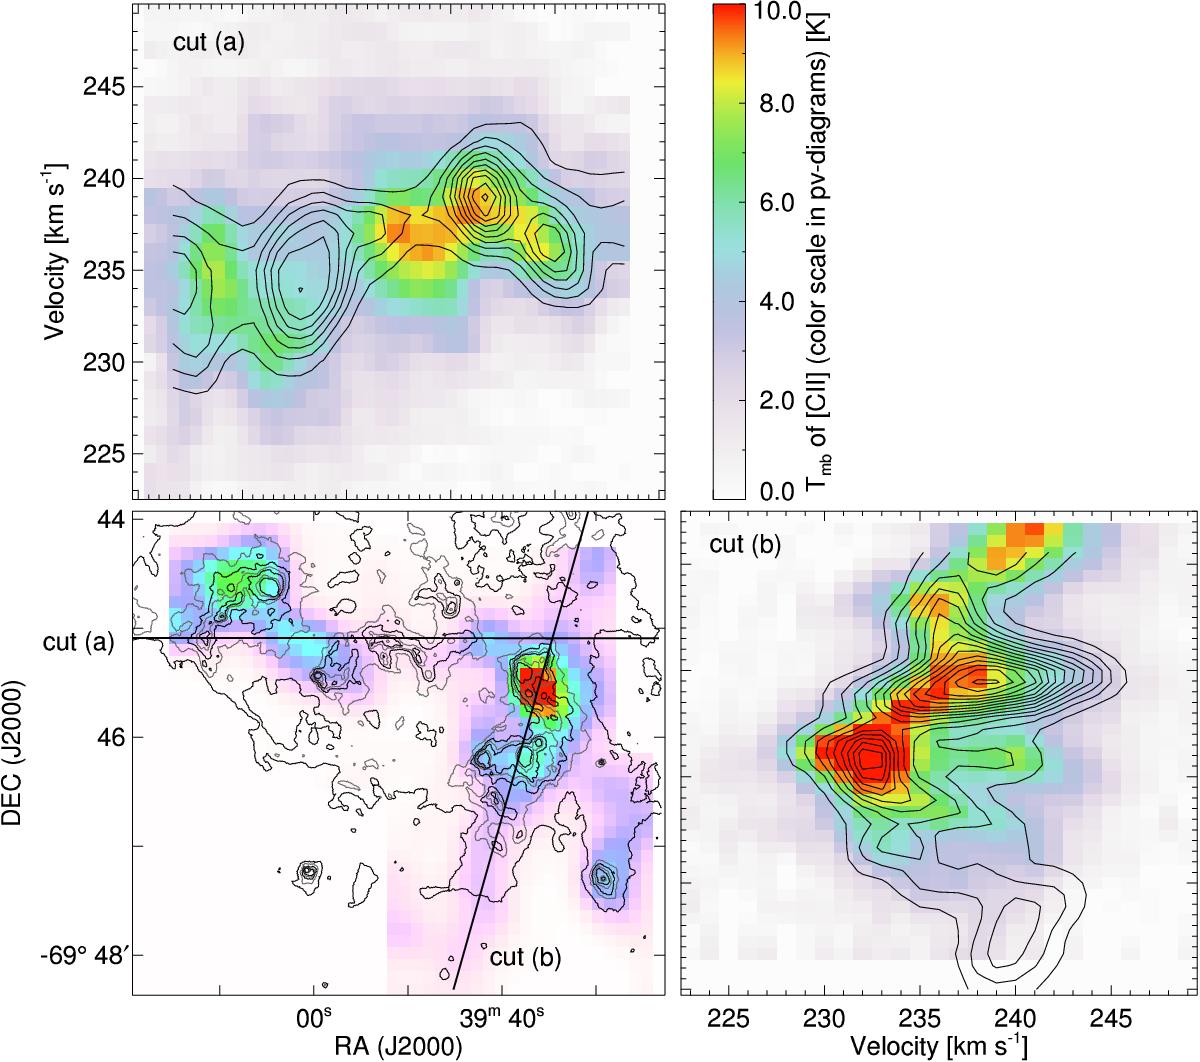
(Lower left) CO(3–2) integrated intensity map overlayed with the contours of IRAC 8 μm (same as Fig. 1), together with two lines marking the two cuts, along which the p − v diagrams are shown in the upper left and lower right panel. (Upper left/lower right) The p − v diagrams of the [C ii] (color) and CO(3–2) (contour) in Tmb [K]. The contour spacing is 1 K. The position axis is horizontal in the upper left panel (cut a)) and vertical in the lower right panel (cut b)), so that the position aligns with the position of the lower left panel.
Current usage metrics show cumulative count of Article Views (full-text article views including HTML views, PDF and ePub downloads, according to the available data) and Abstracts Views on Vision4Press platform.
Data correspond to usage on the plateform after 2015. The current usage metrics is available 48-96 hours after online publication and is updated daily on week days.
Initial download of the metrics may take a while.