Fig. 12
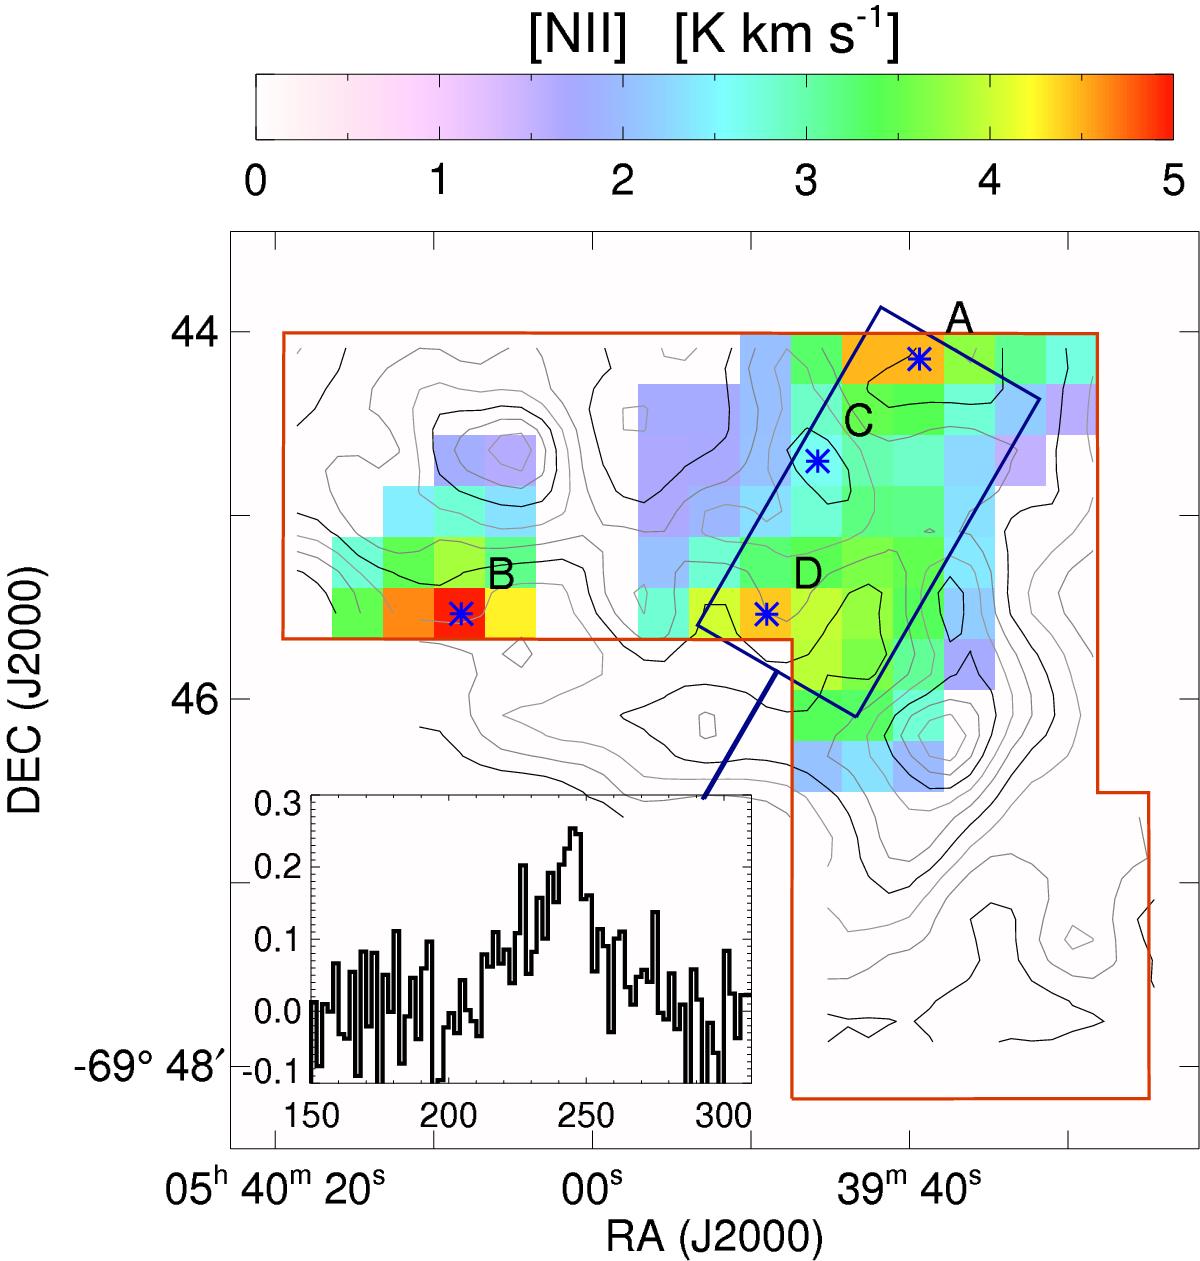
Integrated (220–250 km s-1) intensity map of [N ii] (colors), convolved to 50′′ angular resolution, overlayed with the contours of [C ii] at 20′′ resolution. Blue asterisks show the positions where spectra have been extracted for Fig. 13. The inserted spectrum shows the [N ii] emission averaged in the area marked by the blue box (x-axis is Velocity [km s-1] and y-axis is Tmb [K]).
Current usage metrics show cumulative count of Article Views (full-text article views including HTML views, PDF and ePub downloads, according to the available data) and Abstracts Views on Vision4Press platform.
Data correspond to usage on the plateform after 2015. The current usage metrics is available 48-96 hours after online publication and is updated daily on week days.
Initial download of the metrics may take a while.